By: Mike Kulej
Like many other currencies, the New Zealand Dollar has appreciated strongly against the US Dollar in 2010. It rallied from 0.6560 in May to 0.7640 in recent days. However, this up trend is showing signs of coming under pressure.
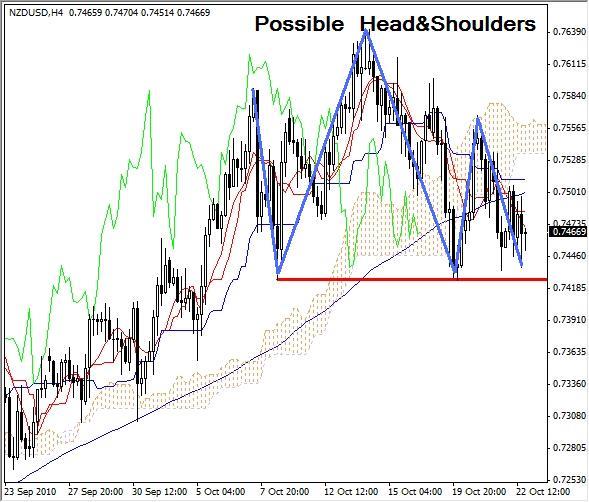
On the intermediate term chart, the NZD-USD has formed a distinctive Head and Shoulders reversal pattern. The Head is at the high of 0.7640, with Shoulders at 0.7590 and 0.7555 respectively.
At the lower end of the pattern, the Neckline is set at 0.7425. In order to complete this formation, the NZD-USD must move under this support, which could happen very soon. Creation of the reversal pattern is not the only sign of weakness here. The price itself is oscillating around the 100 SMA, always an indication of indecision, especially after a prolonged trend, as is the case in this example.
At the moment, the NZD-USD is under this indicator, which has bearish implications. In addition, the Ichimoku charting technique also suggests softness ahead. The price moved under the Kumo (cloud), which now provides new resistance. It was already tested and managed to hold. Altogether, this chart of NZD-USD says that bulls might be losing control.