By: Mike Kulej
It has been a very nice rally for the EUR-USD. Since August, this pair has progressed from 1.2670 to just under 1.4100 last week or over 1400 pips in less than two months. Impressive, but this rally is showing signs of a possible reversal. The intermediate term chart is in early stages of building a topping pattern.
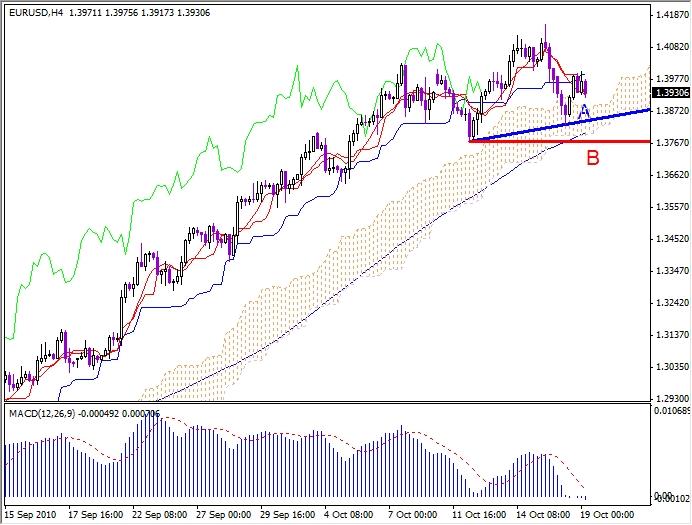
Because it is not complete yet, we cannot be sure, although the price action gives an appearance of a head and shoulder under construction. As things stand now, the line connecting lows of 1.3775 and 1.3830 (A) could be a neckline. Alternatively, the 1.3775 provides another support level (B), which might become a neckline, depending on how the price action develops.
So far the EUR-USD is finding a support on the Kumo of Ichimoku charting technique, commonly known as a “cloud”, hence “cloud charts”. While the Kumo acts as support, a move through it marks a changing trend.
In this case, if the price was to close under the Kumo, that would indicate the end of the bullish rally. Here, a candlestick closing under both the Kumo and one of the support lines could complete the topping pattern and start a bearish trend.