By: Mike Kulej
The EUR-USD has surprised many with its strong uptrend. After reaching a low of 1.1875, in early June, it advanced to 1.3680 recently and the trend looks intact. Now the question is – how much higher can it get?
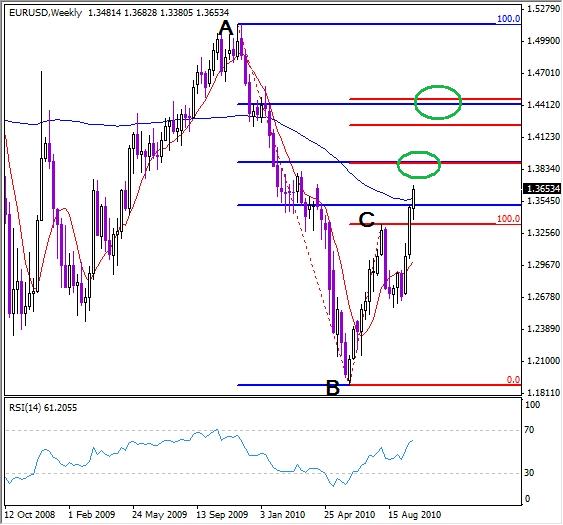
There are plenty of methods to try to establish some possible scenarios and one of them is using the Fibonacci retracements and projections/extensions. At this point, the dominant market swing using the weekly chart is the move down from 1.5145 to 1.1875 (A to B), and the present rally is simply a corrective action within this swing.
Under this assumption, the downtrend should resume in not too distant future. When the Fibonacci retracements (blue) are applied to the A-B price swing, we can see that the EUR-USD has already moved above the 50% level and way on its way to the 62% level, with the 78% still higher.
At the same time, the Fibonacci projections/extensions (red) are plotted for the first upswing from 1.1875 to 1.3333 (B to C). These are the 150%, 162% and 178% extensions. Any convergence of these levels increases the probabilities of a reversal happening there. On this chart, we have two possibilities, at 1.3900 and just above 1.4400.
Either one these levels could mark the end of the rally, especially if combined with a reversal candlestick pattern.