By: Mike Kulej
The Japanese Yen has been getting a lot of press lately. It has been getting stronger, undercutting the 84.80 low from last against the US Dollar and dropping to the lowest level for USD-JPY in 15 years, if only briefly. To counter this rise of the Yen, Japanese officials are hinting at a possible market intervention in its currency.
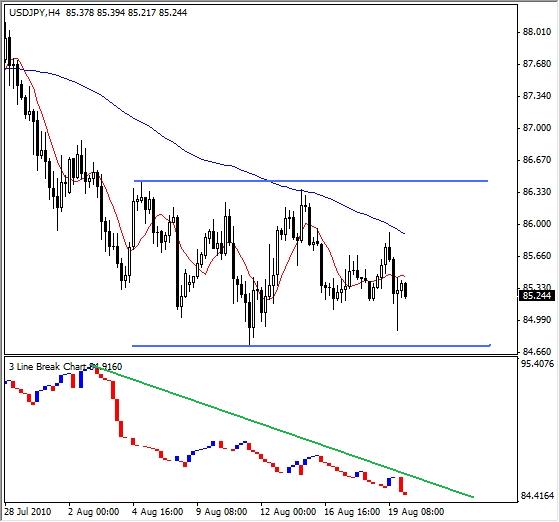
Meanwhile, the USD-JPY is stuck just above the important low, apparently unable to choose direction. This situation is perhaps best visible of an intermediate term chart. For about three weeks now, this pair has been locked in a range between 86.44 and 84.72. By drawing lines at those levels, we can see a rectangle type formation. Under most circumstances, a rectangle is followed by a continuation of previous trend.
In addition, the area of a rectangle where most of the price action is located also indicates the likely next direction. On this chart, there is more activity in the lower part of the triangle, hinting at the eventual resumption of the downtrend. In order to smooth out the chart the noise, one can use the Three Line Break chart, displaying the same data.
Unlike the conventional candlestick chart, the TLB graph still shows a strong, unbroken downtrend. With this in mind, the most likely direction for USD-JPY is to continue down. However, one should be mindful about the possibility of intervention by the Bank of Japan. Such an important fundamental development can override any technical indicator, at least temporarily.