By: Mike Kulej
USD/JPY
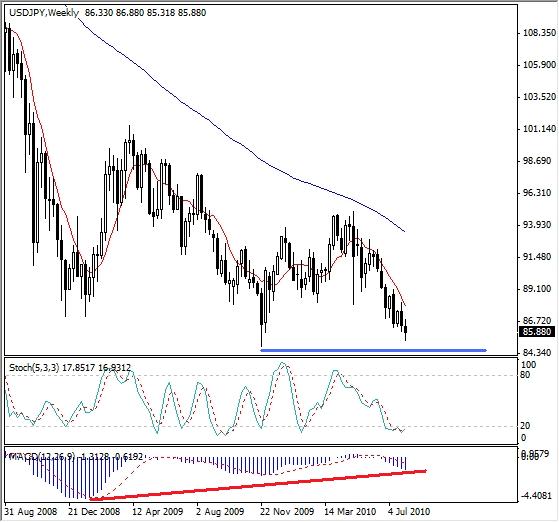
The Japanese Yen- US Dollar pair is steadily approaching the low from last year- 84.80. This is a significant development, because breaching this level would put the USD-JPY in a territory not seen since 1995, when this pair reached an all time low of 79.75.
The Weekly Forex Chart
On the weekly chart, we can see that the 84.80 price level is likely to become an important support, at least for some time. The technical indicators hint that the current down trend may be ending, or pausing soon.
Stochastics Oscillator
Looking at the weekly Stochastics oscillator, we find it in an oversold zone. During the last two years, the price rebounded every time when the reading was this low. Chances are that this will happen again. The MACD indicator, while not severely oversold, is creating a double bullish divergence.
Of course, the divergence will not become “official” until the price makes a new low, but so far, it the indicator is hinting at one. It is important to point out that the oversold/divergence reading of these indicators does not “predict” a reversal of a trend. Rather, it points to a possible correction within existing trend, which, with time could turn into a reversal.