By: Mike Kulej
With a lot of attention on USD/JPY, the other crosses of the Japanese Yen are quietly building chart patterns, which will likely lead to directional price movements. One example is the NZD/JPY.
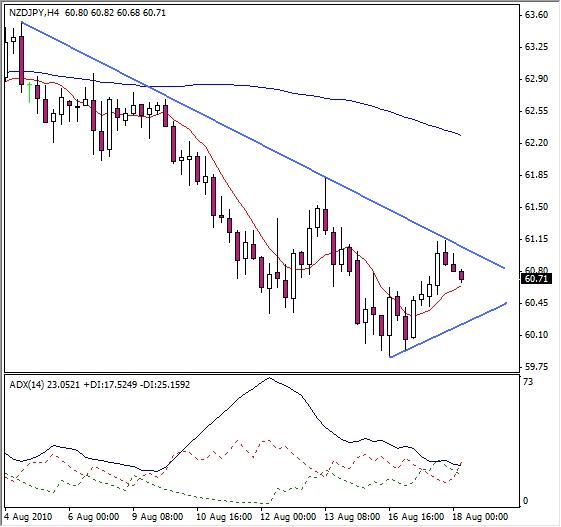
The Kiwi-Yen have fallen substantially during the latest resurgence of the JPY, finding, for now at least, a bottom at 59.86. So far this week, the NZD/JPY has recovered a little bit, although not convincingly enough to call it a reversal. In fact, the most recent price swings became progressively smaller, a clear sign of a market contraction before a more decisive move. This is confirmed by the ADX indicator, which dropped to a very low level, as it often does before a new trend begins.
Using a 4H chart, we can see how the price stayed nicely under the down trendline that connects the most recent highs. On the other hand, the support is provided by a much shorter up trendline. These trendlines create a small symmetrical triangle. With the price approaching the apex of this triangle, a stronger move either way can be expected soon, probably during the next 1-2 days. Even though the formation is relatively small comparing to preceding price swings, it still projects a move of at least 100 pips upon breakout. Not too bad objective for both the NZD/JPY and the time frame, especially if it happens rapidly.
