By: Mike Kulej
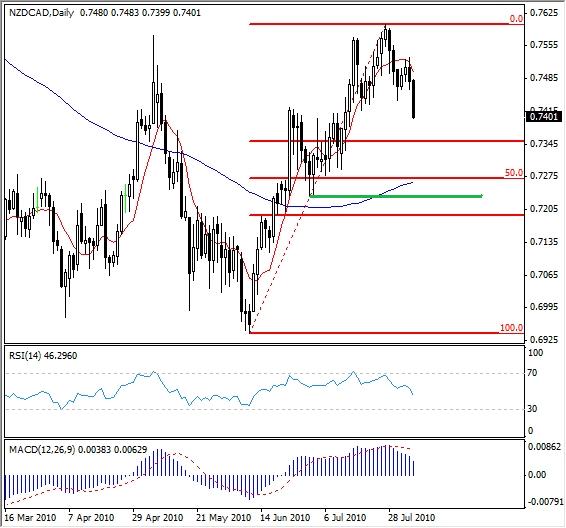
The NZD/CAD has been appreciating in a steady fashion for last two months. This pair advanced from a low of 0.6940 to 0.7600. From there the price started to drift lower. Which brings forward the following question – is this a pullback within the major uptrend, or a reversal?
This most recent bullish uptrend broke above the previous major resistance of 0.7576. While the price stalled right above it, this behavior is normal when markets try to move through a very important support/resistance. It may take few tries before a successful breakout takes place. The most current price development is suggestive of a corrective move within the prevailing uptrend.
In most instances, these pullbacks tend to stop at or near one of the main Fibonacci reversal levels 38%, 50% or 62%. So far, none of them has been reached. The most likely support level is often found at place on a chart where there is a confluence of supportive elements. Here it happens to be 0.7280 level. At that point, the 100 SMA will probably meet with 50% Fib retracement level, providing additional support.
As an additional guide, the RSI indicator could be used. If this sell off in NZD/CAD continues, the oversold threshold of 30 should be watched closely. It might get close to it when the price is touching one the retracement levels. In this case a bullish reversal candlestick might complete the corrective phase and mark a return of the uptrend.
