By: Mike Kulej
Historically, the GBP/CHF pair has been one of the favorite trading instruments among Forex speculators. And for a good reason - it typically moves in a dynamic fashion, offering wide daily trading ranges, creating excellent trading opportunities on all time frames.
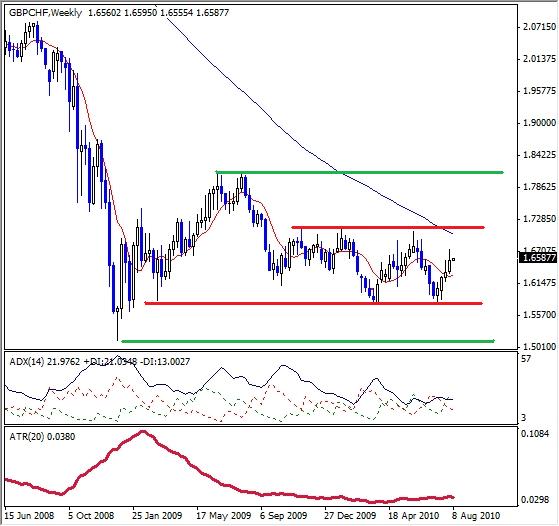
So far this year, however, the GBP/CHF has been very quiet, when compared to previous years. The price is locked in a trading range between 1.5800 and 1.7100, a very tight zone for this pair, especially on this large time frame.
As we can see, the weekly ATR has fallen to about 300 pips, a reading that is normally associated with daily movements. The ADX indicator has flattened to an almost straight line at an extremely low reading. All this is a reflection of a complete lack of direction in this market.
The good news is, conditions like these do not last forever and are often followed by an explosive move out of trading range. Since the current state of affairs has already been prolonged, a new trend could begin soon, within next few price bars. Of course, “soon” on this time scale means at least few weeks, but it is worth following.
The next time the GBP/CHF approaches the most recent support or resistance, it could easily break out in a move worth 300-500 pips in a very short order. Especially if confirmed by an uptick in both the ADX and the ATR indicators.
