By: Mike Kulej
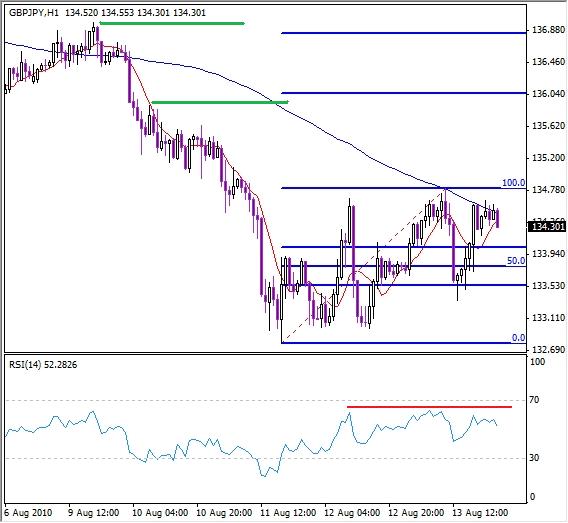
The Japanese Yen pairs have been in a strong down trend recently. For right now, the longer-term charts still show a bearish bias, but some of the shorter-term graphs indicate possible reversals. One of them is the GBP/JPY.
After reaching an intermediate term low of 132.78, this pair rebounded in the later stages of last week, and settled into a base building phase. This price action ran into a resistance in the 134.80, twice, laying ground for a possible bullish breakout. When the Fibonacci extension levels are applied to extremes of the base/consolidation, they indicate couple of likely objectives.
The first, and one with the highest probability of being reached, is the 162% extension at 136.05. The second one, the 200% extension, rests at 136.85. Both if these levels also roughly correspond with previous resistance levels, increasing the likelihood of the market heading there.
The RSI indicator might be used as a breakout confirmation. When in the neutral zone, reading between 30 and 70 (or 20-80, depending on personal preferences), the RSI itself can be “charted” just like the price. In this case, the reading above 62 on the price breakout would serve this purpose. While it does not guarantee that the breakout will be successful, it makes the market’s move more convincing.
