By: Mike Kulej
With the policy meetings by the FED and the Bank of Japan, most of the attention among Forex traders have been directed to the US Dollar and the Japanese Yen. Meanwhile, some of the other currency pairs are developing chart patterns, which could result in promising trading opportunities.
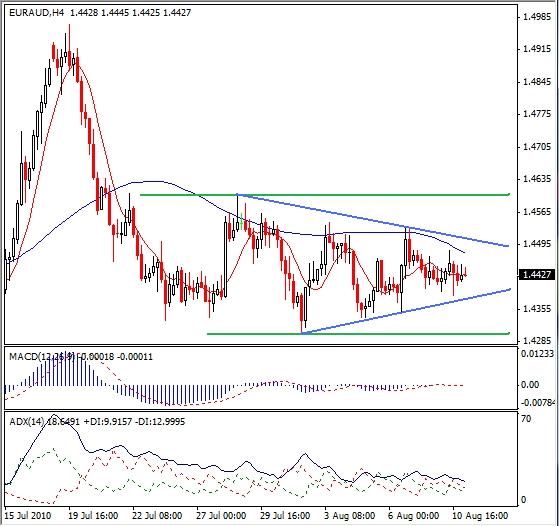
One of those crosses is the EUR/AUD, especially on the intermediate term chart. Following the sharp sell off from 1.4970 to 1.4305, this pair has settled in a sideways movement, lasting about three weeks now. The price is contained between 1.4600 and 1.4305 extremes, with the most recent swings getting smaller and smaller. The result is a well-defined symmetrical triangle, very often a harbinger of a more decisive market move.
A breakout outside of the boundaries of this triangle is likely to take this pair to the next support/resistance, or about 100-120 pips, depending on where exactly the move takes place. That could be followed by one more price swing in the same direction, if the next support/resistance does not hold.
Other technical indicators are extremely flat. Both the MACD and ADX show minimum readings. This also suggests an impending market move. Given the time frame of this chart, one could expect more action in EUR/AUD in a matter of days, probably before the end of this week.
