By: Mike Kulej
Divergence is a very popular concept in the field of technical analysis. They happen when the price of a security and an indicator do not move in the same direction or one is lagging the other. Most often, they form at market highs or lows. Many market participants try to trade them, with a varied degree of success.
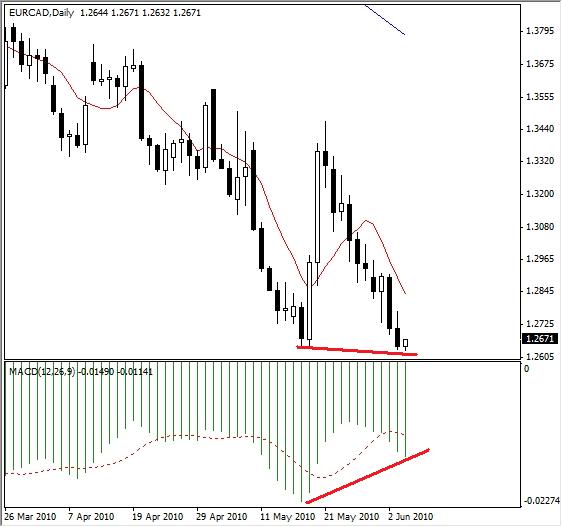
It is easy to spot divergences in the hindsight, but not necessarily so while they are forming. Currently a divergence between the price and the MACD indicator is developing on a daily chart of the EUR-CAD. The price has just made a new low, dropping under the previous extreme from 05.19.2010, which was 1.2644.
At the same time, the MACD indicator has remained above the level reached on that day. This is an example of a bullish divergence, indicating possible oversold conditions. That, in turn, could suggest a correction within the existing downtrend, possibly leading to a trend reversal.
This divergence itself is not a signal to buy the EUR-CAD. It needs additional confirmation, by emergence of a bullish reversal candlestick pattern or another entry signal of own choosing. However, this is a divergence, which increases the probabilities for a correction/reversal in the near future.