By: Mike Kulej
Over the last few days, the GBP-USD pair advanced about 400 pips. Many voices are being raised about a longer-term reversal taking place here. Is it? Since the beginning of 2010, this pair fell from 1.6450 to about 1.4250.
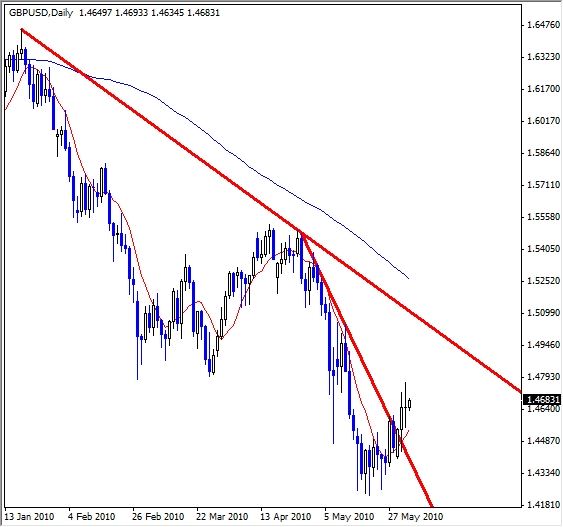
This is clearly a well developed down trend. About the simplest way to define a trend is by drawing a trendline, connecting the highs/lows. By definition, a trend is valid for as long as the price action stays on one side of its trendline. The dominant trendline for the GBP-USD daily chart connects the high points from January and April.
So far, the price managed to break above a minor trendline, but is still far away from the main one. Until this trendline is breached, the downtrend is intact. For now, by the standards of technical analysis, this market is in a corrective move within the larger downtrend. Should this upward momentum continue the trendline could be broken around the 1.4900 level, which is very close to the most recent minor high, at 1.5000.
What happens in that zone will probably decide the direction of GBP-USD for the next few weeks or even months. Right now, this market is still in the downtrend, for as long as the trendline holds.