By: Mike Kulej
The recent rebound in the GBP-NZD pair stalled over the last few days. This pair had been in a seeming free-fall for weeks and even months. While the long-term bearish trend is still intact, the intermediate term chart can be interpreted as having turned bullish.
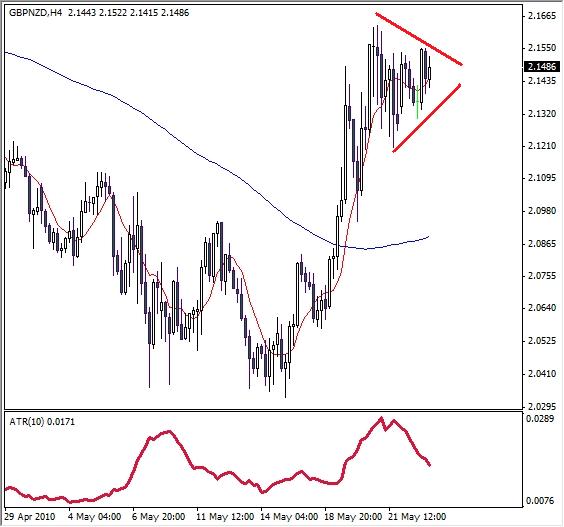
On this time frame, the GBP-NZD broke decisively above latest highs of 2.0950 and 2.1120, and reached even higher. Currently the 4-hour chart is showing a possible bullish flag, which has a range of about 400 pips. This potential flag has a bullish quality, because it follows a very steep price run up.
As a rule, flags tend to be tight, short-lived formations, which suggest a continuation of the preceding trend – a bullish one in this example. The Average True Range indicator contracted sharply from the recent high reading and supports the notion of a stronger, directional move in the near future, perhaps as large as 400 pips. It should happen soon.