By: Bradley C. Smith
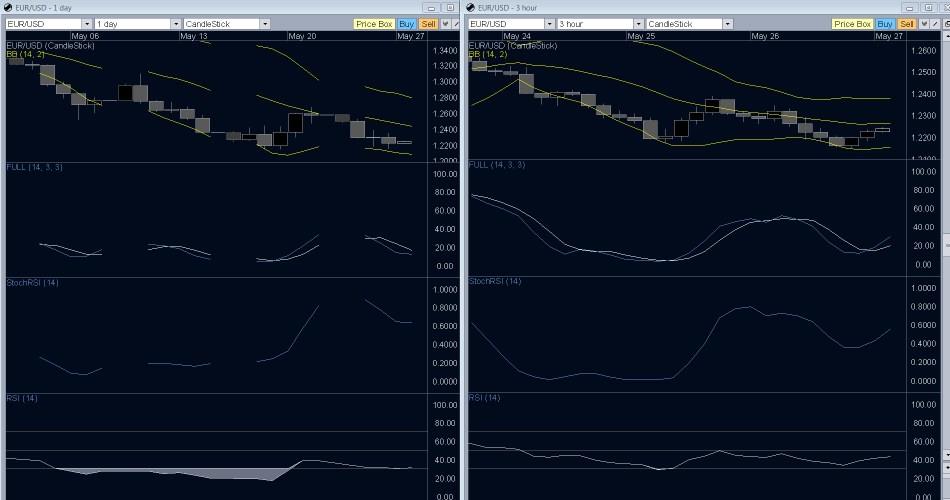
No matter what the Bollinger Bands, Full Stochastics, StochRSI and RSI might tell the EUR/USD to do, the trend and both big forecasts clearly have a downward direction in mind for the 27th. How far with this pair plummet? You need not worry about that if you have a tailing stop at the top of a recent area of resistance. To get that area for the course of a day lets look at the three hour chart.
If you are not sure of how far this pair might fall, try a trailing stop that will accommodate for recent market chaos by being large enough. The range of each candle yesterday seems to average around 60 pips on the three hour chart. Tighten up the trailing stop when a large news item is about to hit, to accommodate for clear support and resistance areas and to your tastes, if you want to.
8:30am est USD
Prelim GDP q/q Forecast 3.5% Previous 3.2%
8:30am est USD
Unemployment Claims Forecast 450K Previous 471K