By: Hamid
These last several days have presented some excellent opportunities on GBP/USD that are well worth examining especially in the light of the analysis I posted last week on this pair.
To recap, look at Chart 1: last week, I highlighted a bounce off a key Fibonacci level, 88.6% and proposed that it would create an extension of Wave 1 from the Bottom of Wave 2.
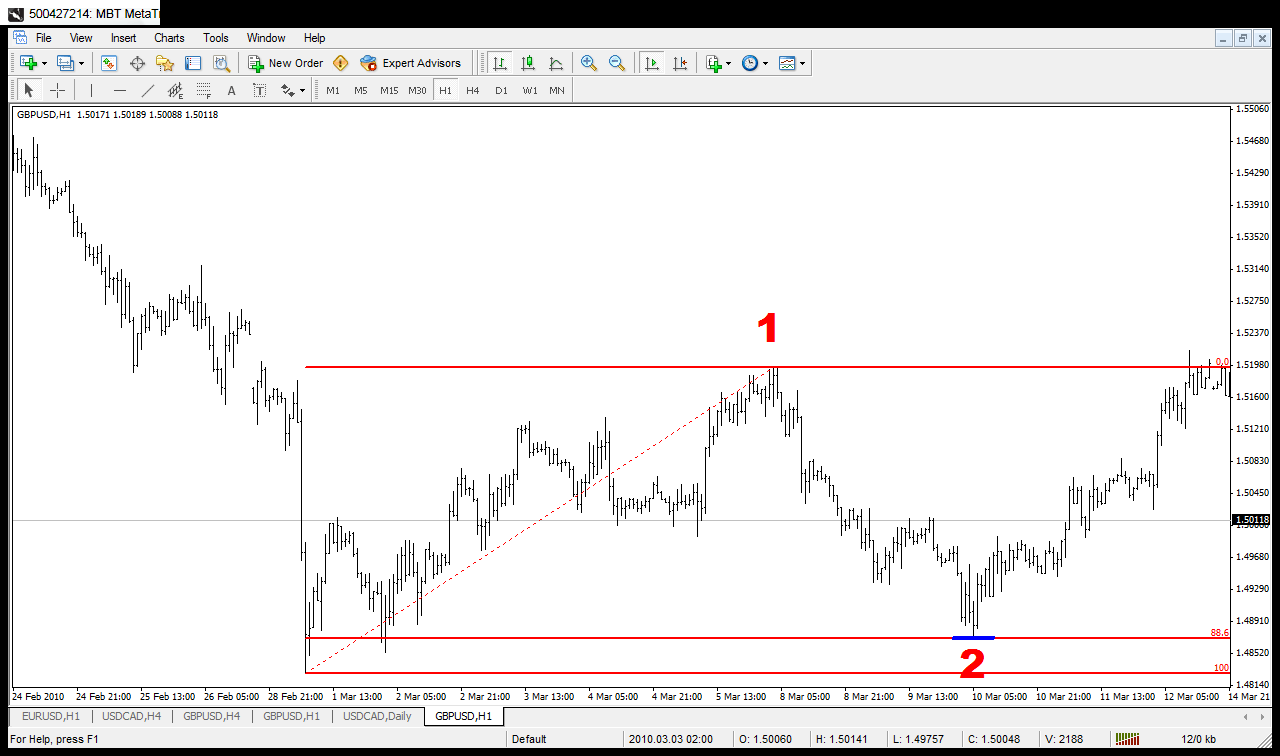
Let’s briefly touch upon the importance of the Fibonacci number 88.6%. This number is the square root of 78.6%, which itself is the square root of 61.8%, or the Fibonacci Golden Ratio. In my own experience, a bounce off 88.6% provides the strongest moves and moves that aren’t false; it is the only Fibonacci level I use without requiring many other confirming factors.
And more often than not, an 88.6% bounce means that the next move will extend the size of the initial move. On Chart 1, that means you can expect the move from the end of Wave 2 to be at least 100% of the size of Wave 1, if not bigger. This is the first important consideration when planning the trade: it means you can plan as a minimum target 100% of Wave 1 from end of Wave 2. Having a clear target means you can decide whether the risk is worth it before getting into the trade. Make sense so far?
Getting into the trade
So what happened next? At the time of the analysis last week, the price had just hit two coinciding Fibonacci levels and I advised that as it was sitting on some resistance, it would be better to buy on a dip below, which happened a short while later.
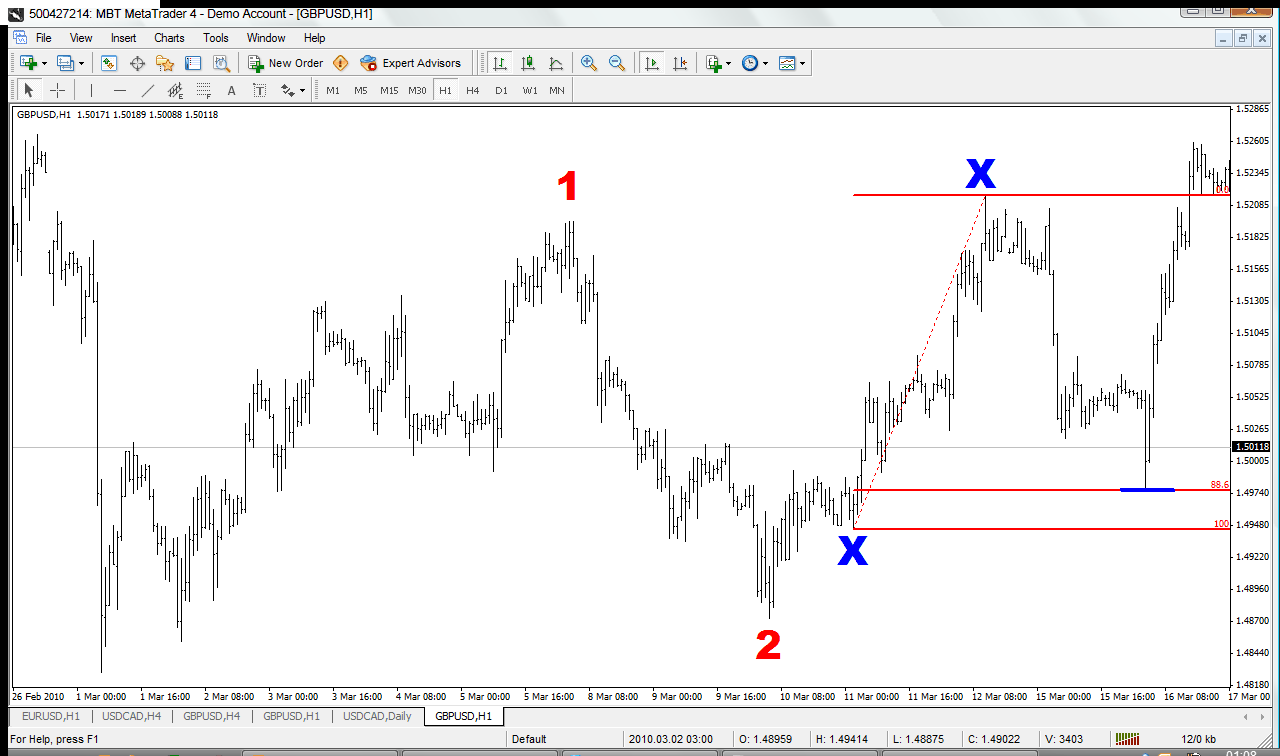
The first dip produced a nice spike down coinciding with another 88.6% bounce: see Chart 2. This Fibonacci point was a little harder to spot, but if you did spot it, even shortly after it happened (which was the case for me) rather than in advance, it added reinforcement to go long at that point. Entry just after the spike provides 150 pips at the very least, and much more as the trade unfolded.
The price then hit the extension of Wave 1 from the bottom of Wave 2 at exactly 138.2%. At the time of my initial analysis last week I thought 161.8% would be hit. At 138.2%, the trade provided 150 to 300 pips depending on where you got in and how you trailed your stops.
Getting out of the trade
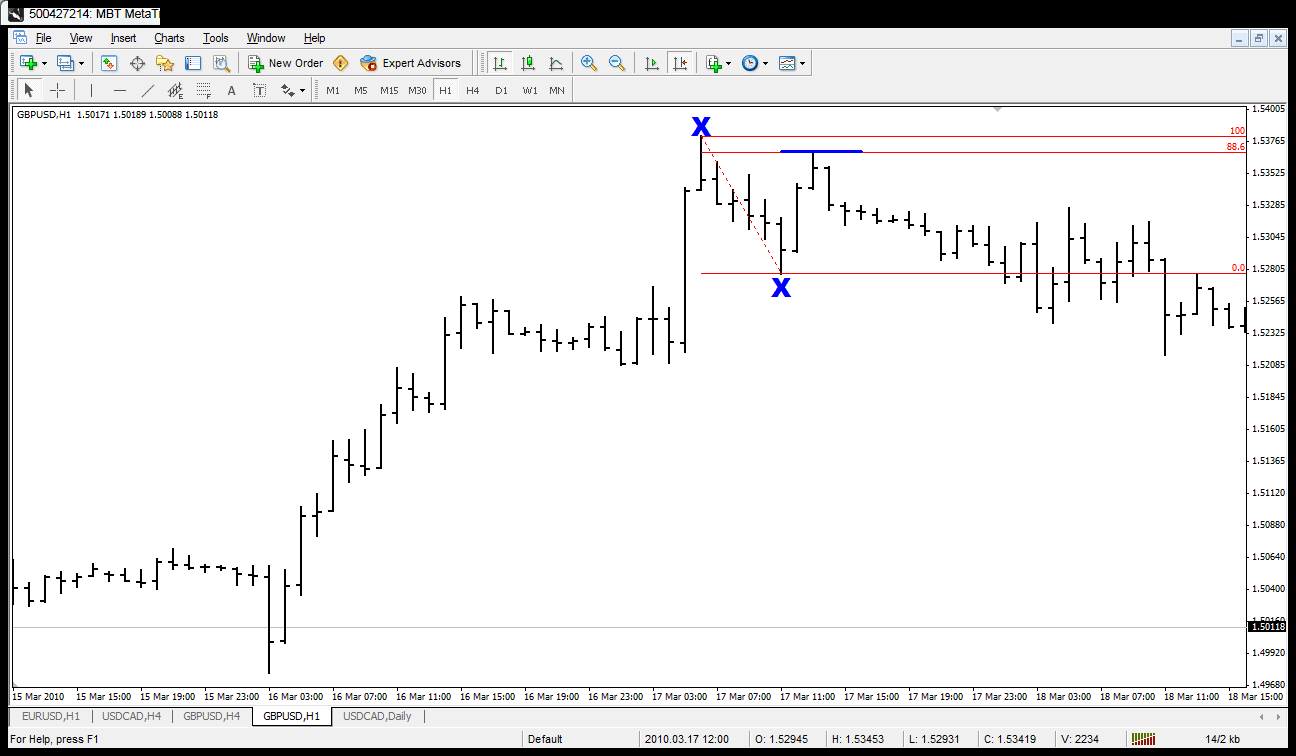
Interestingly, after hitting the 138.2% extension, there was a subsequent 88.6% retracement in the other direction giving you a good warning that the up move is either going to struggle or is over: see Chart 3. This could also have been a valid reason to initiate a new short position.
Something I didn’t see at the time of the post last week was the importance of that 138.2% extension. If you looked at another longer term Fib retracement marked on Chart 4, that 138.2% extension is an exact match with a longer term 38.2% retracement marked by the blue lines. (This was a far better match than the longer term Fibonacci lines in my first analysis – as this time, the these lines met exactly.)
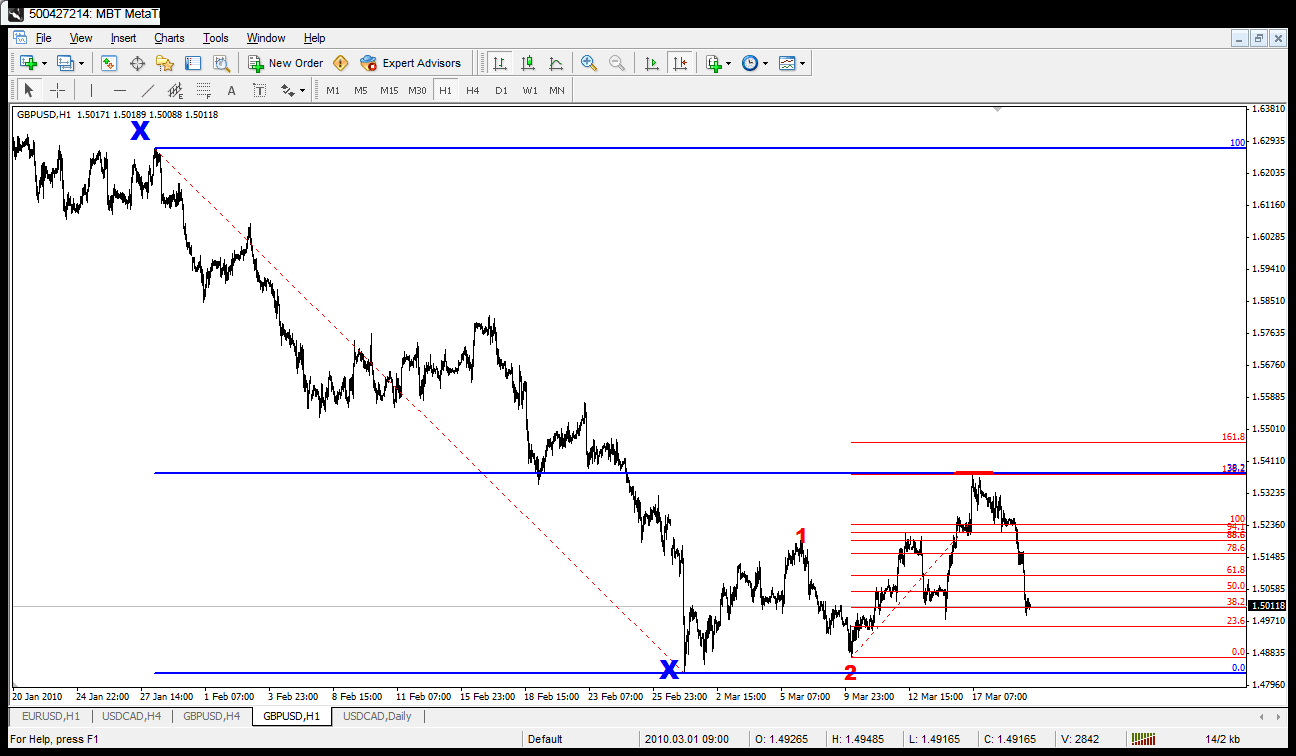
When Fibonacci lines meet exactly it can produce strong turning points. Notice how the price travelled hundreds of pips yet bounced cleanly off both lines within 1-2 pips. If that wasn’t a sign to exit, it should have been a sign to keep your stops close.
For reference, all the charts are hourly bars. However, equally 4-hour bars could be used. If any readers would like to see the charts more clearly than the posting here, either go to www.simplyprofit.net or email me directly on hamid@simplyprofit.net and I will email back the original charts. H. Hamid hamid@simplyprofit.net
GBP/USD 150-300 pip move

I’m a trader and manage my own capital. I trade the major Forex pairs, some Futures contracts, and I rely entirely on Technical Analysis to place my trades. Today, I am also a Senior Analyst for DailyForex.com. I began trading the markets in the early 1990s, at the age of sixteen. I had a few hundred British pounds saved up (I grew up in England), with which I was able to open a small account with some help from my Dad. I started my trading j...
Read more I’m a trader and manage my own capital. I trade the major Forex pairs, some Futures contracts, and I rely entirely on Technical Analysis to place my trades. Today, I am also a Senior Analyst for DailyForex.com. I began trading the markets in the early 1990s, at the age of sixteen. I had a few hundred British pounds saved up (I grew up in England), with which I was able to open a small account with some help from my Dad. I started my trading journey by buying UK equities that I had read about in the business sections of newspapers. The 1990s were a bull market, so naturally, I made money. I was fortunate enough in my early twenties to have a friend that recommended a Technical Analysis course run by a British trader who emphasized raw chart analysis without indicators. Having this first-principles approach to charts influences how I trade to this day.