By: Bradley C. Smith
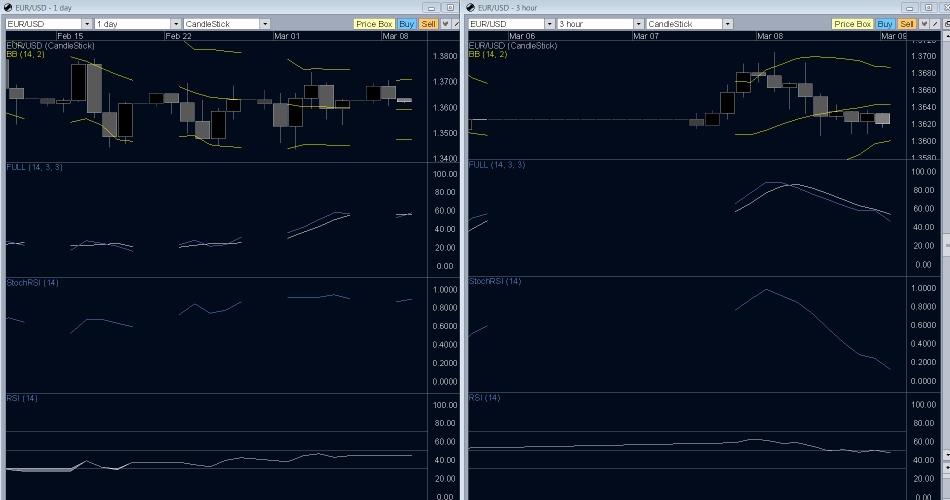
With no heavy news releases for the EUR/USD pair today we are turning to the Bollinger Bands, Full Stochastics, StochRSI and RSI that are there every day for us. Each of which is at or above their centerline, which signifies traders are likely to keep the price action in it's current range or go below this range. Let's look to the three hour chart for further insight.
Each indicator's direction is clearly down, showing the intent of market movers. This combined with the range bound daily chart in recent weeks shows the day will contribute to the other range bound days. If you want to test some scalping strategies, enjoy.