USD Begins New Year by Losing Across the Board by GoLearn Forex
USD/CAD:
The New Year is off to a volatile start with Dollar losing across the board. If we are not in an existing position then trading the intra-day trends on a fast time frame can present some decent opportunities.
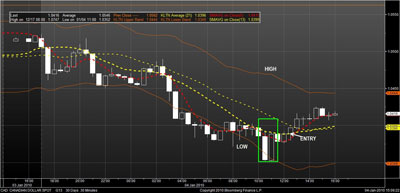
In the chart below we use a 30 minute USD/CAD. We overlay Keltner Bands to represent a moving average deviation. The bands essentially act as moving average Support and Resistance (S&R). As with any S&R you need to evaluate whether a reversal or breakout will occur as price approaches the band.
INSERT CHART
We use a combination of candlestick patterns, moving averages, and the step pattern to help us gauge whether the price action is strong enough to force a break out or whether a reversal is imminent. The first step is to wait for price action to touch the outer band. Once that happens we look for a candlestick patterns suggesting a reversal. In the boxed area, we highlighted an engulfing candlestick. The is a candlestick whose body completely engulfs the prior candle, typically signaling a reversal.
The next confirmation of a pending reversal is the convergence of MA's. We use Fibonacci sequence for the averages, such as the SMA 5(red line) and SMA 13(yellow line). We wait for the MA's to cross signaling a change in trend. Lastly, (when possible) we wait for price to reach the prior high (or low as the case may be) in the step pattern, whereby lower highs and lower lows signal a down trend and vice versa. The combination of all these factors signals a Short CAD entry. Remember that day trading requires constant monitoring and more technical analysis than trading over the long range. Additionally, it is preferable to trade in the direction of the overall long term trend.