The EUR shares a commonality with the Greenback. Together they form the most traded currency pair of all the pairs available to trade. Look at the largest economies that make up the global landscape and it becomes apparent why. At times it also makes it one of the more difficult pairs to trade. Volatility will often stop out even the most skilled of day traders.
The EUR hit a high back on November 25th, 2009 of 1.5144, only to be followed by a low of 1.4218 less than one month later, a 6.1% drop. If you draw a Fibonacci Retrace from that high to the low you will see that the EUR just bounced off of the 38.2% Retrace level at 1.4572. In the Chart below we diagram this on a 4hr time frame.
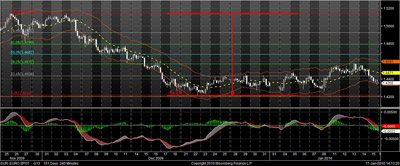
We added Keltner Channels to the 4hr chart above. We use Keltner Channels as a means of identifying potential Support and Resistance handles. Recall, that the outer Keltner bands represent a deviation from the mean. When price deviates far enough either a reversal is forth coming or the trend is so strong that price action has further room to appreciate.
The question as always is “how do you differentiate between trend strength and trend weakness in anticipation of a reversal?” There are many momentum studies you can choose from on your platform as well as many overbought/oversold indicators. The most commonly used indicator is the MACD. On the lower portion of the Chart we added the MACD which works best when a pair is trading the range. On a 4hr chart ranges and trends are more apparent and more prevalent versus a chart with a longer time frame.
Here is how to interpret the chart above. Price struck a low of 1.4218 and then proceeds to retrace. Price breaks the first Fibonacci Retrace level of 23.6%, or 1.4436. It then continues onwards and strikes the upper outer band of the Keltner Channel. The first flag that either the trend is strong or a reversal is imminent. The MACD show the trend to be strong and indeed price moves slowly higher. The MACD at this point has plateaued just as price hits the next Fibonacci Retrace level at 38.2%, or 1.4572. Price action then starts pushing the EUR lower and you can confirm the reversal is in full swing by the MACD movement. The signal line is above the MACD and the histogram displays the differential between the MACD and signal line. They have widened considerably, indicating a strong move down.
So what is next for the EUR? Price has moved to the lower band of the Keltner Channel and the MACD is still open wide. This points to a lower EUR. A significant short entry signal would trigger with a break below the 1.4218 handle, or the low that formed the basis of our Fibonacci Retrace. Therefore it would be our conclusion that at current levels the EUR is looking quite vulnerable.