USD/CAD:
The Canadian Dollar from a technical standpoint is giving every indication it is going to breakout. Price has been consolidating for several weeks. You can see more clearly the consolidation in the Chart below depicted by the orange triangle.
Typically we draw a triangle where only one side represents the slope. However, the triangle drawn below is indicative of investor’s uncertainty with regards to the CAD. The Canadian economy is holding strong. The CAD is a commodity currency and will rise and fall as commodity prices rise and fall (in particular Oil). The Dollar has been rallying which should mean a weaker Loonie, but this rally stems from positive U.S economic data. The U.S economy and that of their northern neighbor are linked to a certain extent as they feed off of one another. Therefore, positive U.S data should also be good for the CAD. Therein lies the conflict and thus you have a dual sided sloping triangle.
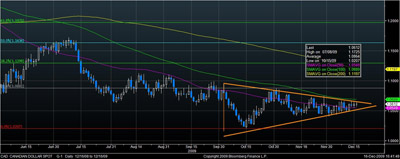
The CAD is currently trading above its 50 day MA. Similar to the AUD and NZD it failed to breach the 100 day MA in spite of the Dollar rally. As the CAD wedges itself into the triangle we are looking for the following to occur in order to trip an entry signal. If the Loonie produces a candle south of the 50 day MA and south of the bottom slope of the triangle then look to enter a Long CAD position. Alternatively, if the CAD produces a candle body north up the upper slope of the triangle and the 100 day MA then enter a Short CAD position. Lastly, if a Short CAD signal triggers we see a near term take profit level at 1.0880 coinciding with the Fibonacci 23.6% Retrace level. We view this level as strong point of resistance.