By: GoLearnForex
GBP/USD
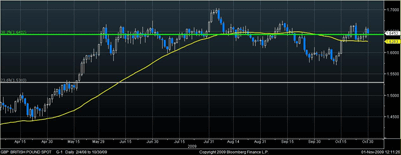
: The Pound has been range bound for some time. It is trading between 1.6650 and 1.61. Price action above or below those levels has lead to a number of false breakouts. Interestingly enough, if you draw a Fibonacci Retracement from the Pound's high at 2.1160 in 2007 to the Pound's low just below 1.35 in 2009, you will notice that the 38.2% Fibonacci level is at 1.6422.

That level is significant because over the last 6 months we have had more candles extend through this level than above or below it. On the Chart is the 50 day MA in yellow which also had been hovering along the same Fibo line. In October the 50 day MA dipped below the 38.2% Fibo level but price has since recovered in the last week.
Typically price will either trend and break through various Fibonacci levels, or it will range in between 2 Fibonacci levels as it searches for direction. When price hugs a level for a considerable time you expect to see a breakout. We expect to see a shift in this pattern that will cause price to break free of the 38.2% Fibonacci level at 1.6422.
EUR/USD
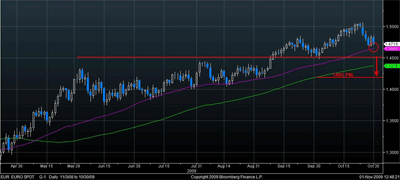
: The EUR has been holding support at a level equal to its 50 day MA since April 30th. The EUR is now in range to test that level of support. Here is what we are looking for as confirmation of a real move lower.
We want to see at least a whole candle including its wicks fall between the 50 day and 100 day MA. Additionally, the last lower low we had was at the 1.45 handle. If we break that level we would increase the short position.
If the short entry presents itself we would take PNL at the 1.4225 handle and reevaluate the markets and our positions at that time.