
The EUR/USD has gone into this weekend near the 1.14165 ratio as risk sentiment in the broad financial markets continued to stay sour and create a bearish stampede.
Technical Analysis
The following are the most recent pieces of Forex technical analysis from around the world. The Forex technical analysis below covers the various currencies on the market and the most recent trends, technical indicators, as well as resistance and support levels.


The EUR/USD has gone into this weekend near the 1.14165 ratio as risk sentiment in the broad financial markets continued to stay sour and create a bearish stampede.
The escalating war in the middle east is pushing energies higher, stocks lower, and generating considerable fear about what happens next, especially in the Gulf nations which are being attacked by Iran.
WTI Crude Oil closed above 99.000 going into the weekend, this as anxious large players try to gauge their outlooks regarding Iranian war implications and circumstances that are effecting sentiment quickly.
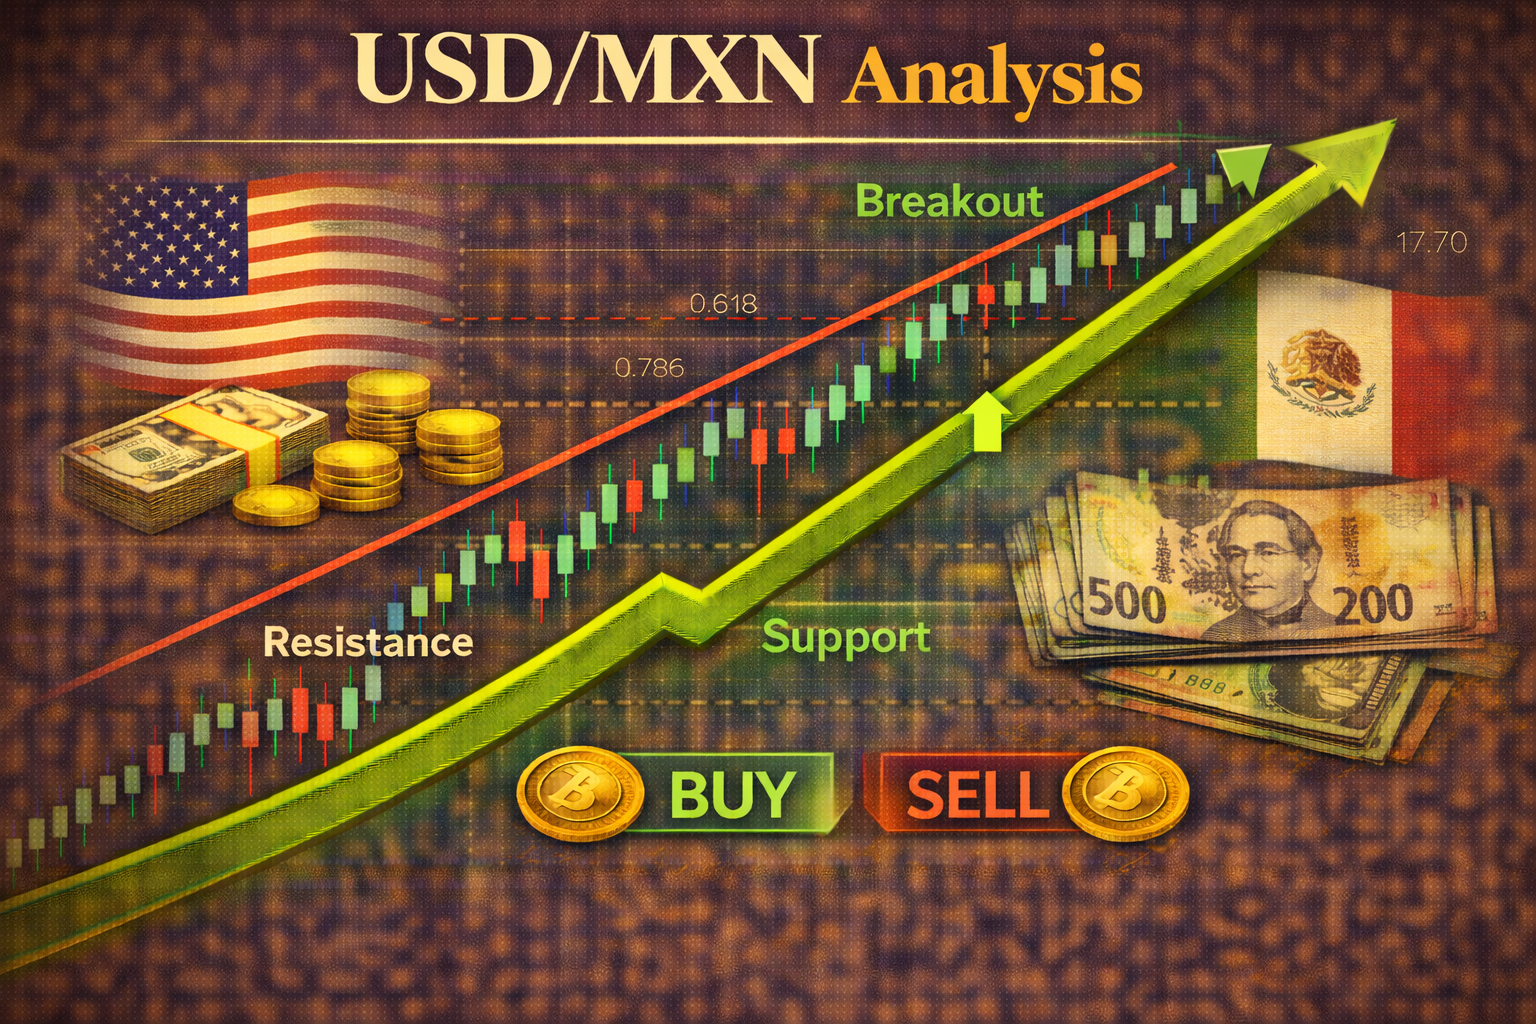
Market focus on major forex pairs and indices including USD/MXN, EUR/USD, NASDAQ 100, GBP/USD, USD/CAD, USD/ZAR, and DAX with key levels to watch.
USD/MXN is bouncing on risk-off flows, but 18.00 remains the key resistance level where sellers may look to reenter the broader downtrend.
Gold remains volatile but bullish overall, with $5,000 acting as key support and $5,350 as the upside target if buyers step back in near the 50-day EMA.
Crude oil continues to rally on geopolitical risks after tanker attacks in the Strait of Hormuz, though extreme volatility means traders should stay bullish but cautious.
CAD/JPY continues to favor the upside, with oil strength supporting the Canadian dollar and 115.50 acting as key support for a move toward 118.
Silver remains trapped in a choppy range, with $90 as near-term resistance, $80 as key support, and a longer-term bullish bias still intact above $70.
USD/JPY remains bullish after Thursday’s rebound, with dip-buying in focus and 160 acting as the key breakout level for a much bigger upside move.
USD/CAD rallied as broader risk-off flows outweighed oil strength, keeping the pair in its familiar 1.35 to 1.3750 consolidation range.
GBP/USD remains trapped in a volatile 1.3250–1.35 range, with downside pressure building below the 200-day EMA but no decisive breakdown yet.
The volatility that crypto is known for has been in full force in March, largely due to factors outside of the influence of investors, leaving many longing for a little peace and stability.
There is a medium-term descending price channel which continues to hold the price lower, but the price action within this is so choppy that it is hard to trade.
The USD/MXN is around the 17.71575 as fast conditions continue to be demonstrated on trading platforms as speculators try to purse opportunities in a Forex market that is volatile.