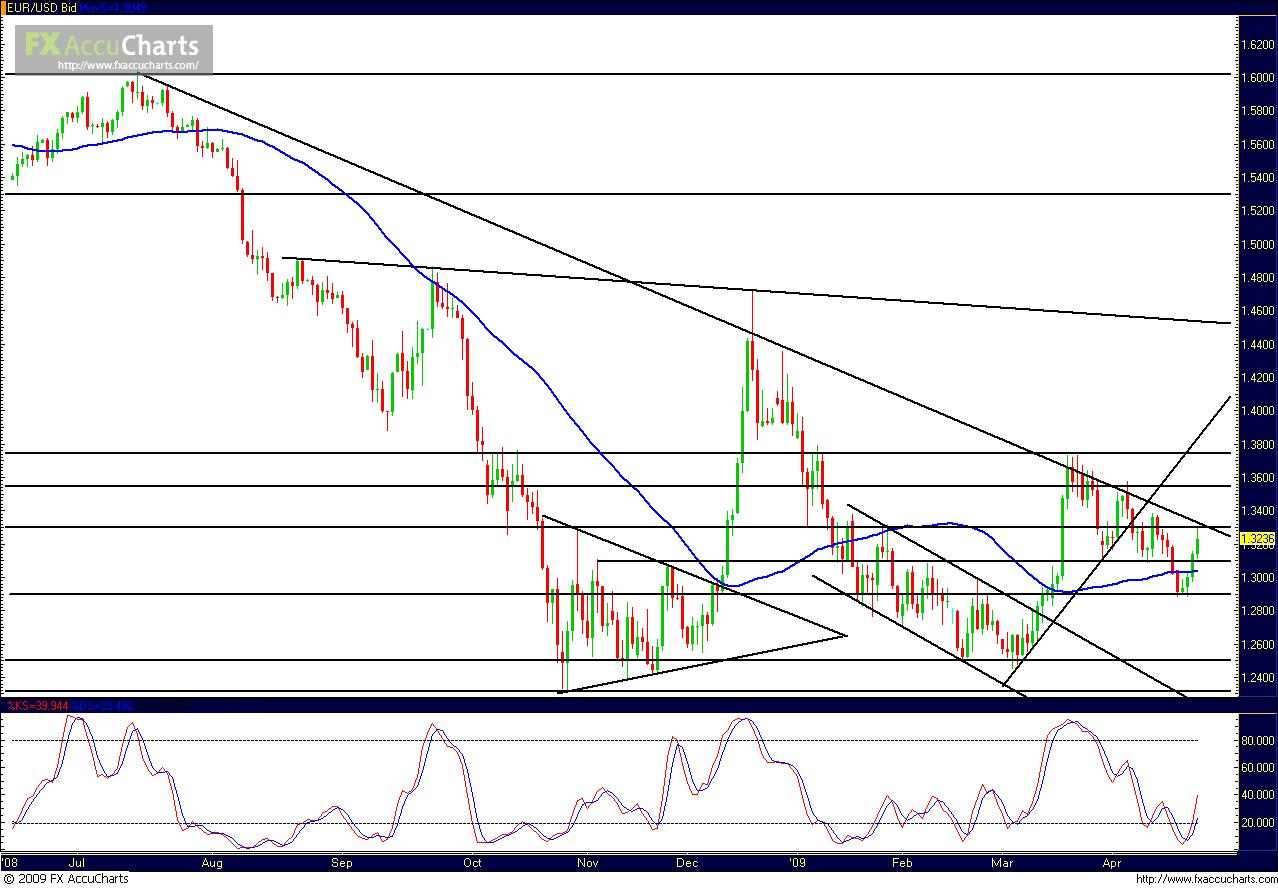
EUR/USD
EUR/USD (a daily chart of which is shown) displayed some significant bullishness in the past week that extended all the way up to around the key 1.3300 resistance level before retreating this past Friday. Currently, this 1.3300 level coincides approximately with a major downtrend resistance line extending from the 2nd test of 1.6 all the way back in July. Therefore, the upcoming week of April 27 to May 1 finds the pair at a critical juncture. Will EUR/USD respect both static and dynamic resistance by reversing the bullish retracement of last week and ultimately targeting February and March lows. Or will the pair breakout above 1.3300 and the long-term downtrend resistance line, potentially to end the overall downtrend that has been in place for many months now. Price action early in the upcoming week should provide some clear-cut direction. Any strong breakout above 1.3300 and the long-term downtrend resistance line should jeopardize the downtrend and potentially target further resistance in the 1.3550 price region. If price is rejected at resistance and turns decisively to the downside in the beginning of the week, a clear target below 1.3100 support resides around the key 1.2900 price level, the approximate region of the last swing low.
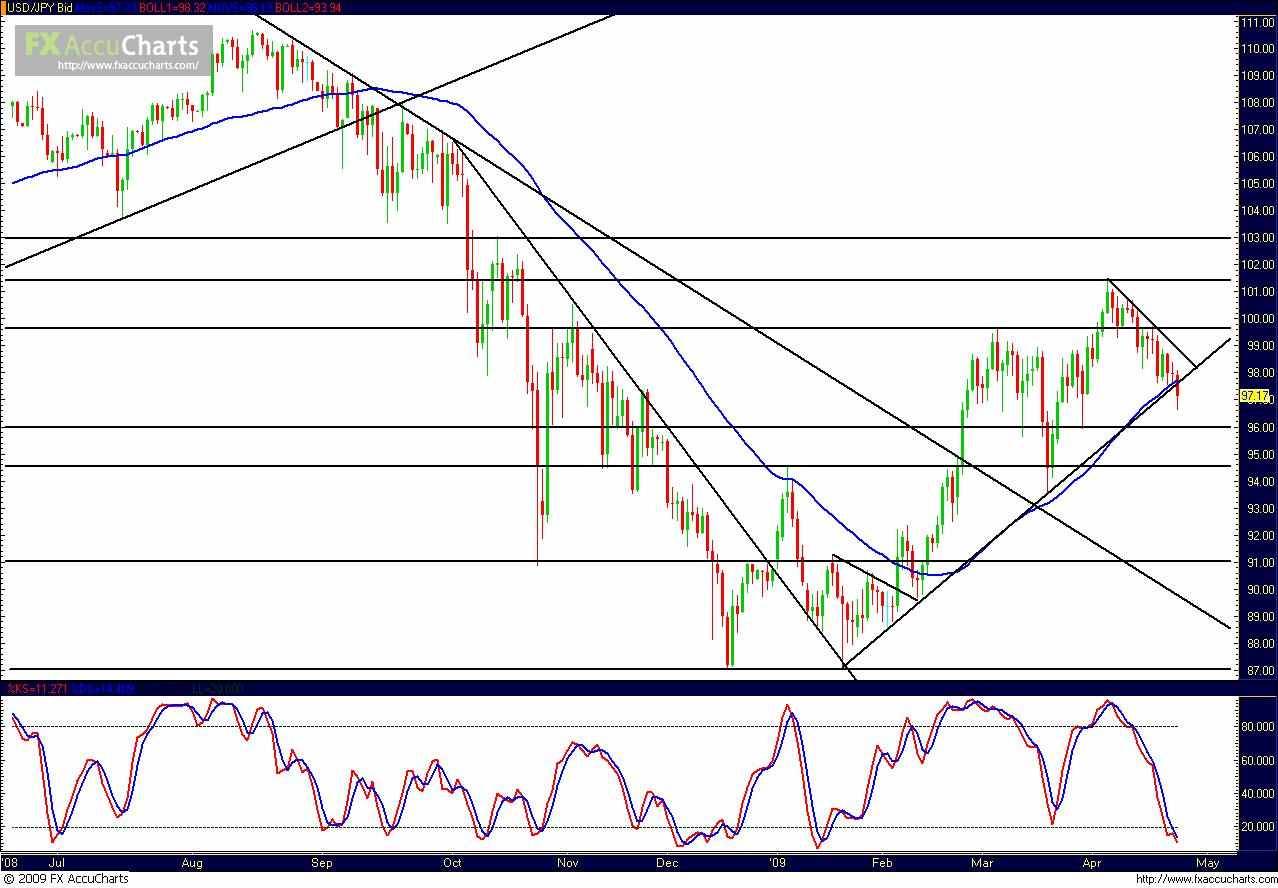
USD/JPY
USD/JPY (a daily chart of which is shown) broke down below a key uptrend support line this past Friday as bearishness prevailed for most of the week. This uptrend support line extends from the second test of 87.00 back in January. The trendline was unable to contain the bearishness of the pair, which has followed a short-term downtrend resistance line extending from the 101.43 swing high hit just three weeks ago. The upcoming week of April 27 to May 1 should confirm whether the uptrend line breakdown was, in fact, real or not. Continued downside momentum on the bearish break of the uptrend support line could easily shoot for 96.00, and then potentially further down around 94.60, the peak between the 87.00 double bottoms. If the trendline breakdown proves during the upcoming week to have been false, a re-break above the line could once again target resistance in the 99.65 price region.