Price-based chart patterns are my favorite trading tool. They show the balance between buyers and sellers that few other tools match. Chart patterns do not lag like moving averages and other such indicators, and they give me immediate feedback on whether I am right or wrong.
Harmonic patterns have all these advantages, and they go one step further—they are one of the few chart patterns that incorporate Fibonacci analysis into their structure. Their predictive capabilities have given Hamonic patterns a strong following in the trading community.
Let’s explore how Harmonic patterns work, the different types, and how to use them in trading.
Top Regulated Brokers
What Are Harmonic Patterns?
Harmonic patterns are price-based chart patterns, first established with the Gartley pattern invented by H. M. Gartley in the 1930s. Others came along and built on Gartley’s work, but the person who developed them the most and coined the term “Harmonic Patterns” is Scott M. Carney.
Harmonic patterns are much more complex than traditional chart patterns, such as triangles or double-tops. The different types of harmonic patterns incorporate Fibonacci levels in their structure—something that traditional chart patterns such as head-and-shoulders or triangles do not do.
Fibonacci Ratios
Let’s cover Fibonacci ratios as they are intrinsic to Harmonic structures. If you already understand Fibonacci ratios, feel free to skip this section.
The Fibonacci sequence is a series of numbers where each number is the sum of the two previous numbers, starting at 0 and 1:
0, 1, 1, 2, 3, 5, 8, 13, 21, 34, 55, 89, 144, 233, 377, 377, 610, 987, 1597, 2584, 4181, 6765… the sequence continues without stopping.
Take any two consecutive numbers in the sequence, e.g., 144 and 233, or 34 and 55, or 4181 and 6165, and divide the smaller by the larger number. The answer will always be close to a specific ratio, approximately 0.618—known as the Golden Ratio.
The Golden Ratio has unique mathematical properties, and some argue it is present in nature. For example, the number of seeds in a sunflower, honeybees’ family trees, and the spiral of a nautilus shell all follow the Fibonacci sequence. Because Fibonacci ratios are present in nature, theoretically, they should be present in the natural buying and selling process that results in chart patterns.
Other Fibonacci ratios are derived from the Golden Ratio. For example, 78.6% is the square root of 61.8%, and 38.2% is the ratio of two Fibonacci numbers two spaces apart.
Types of Harmonic Patterns
I will review seven key Harmonic Patterns: ABCD, Gartley, Bat, Crab, Butterfly, Shark, and 5-0.
ABCD Pattern
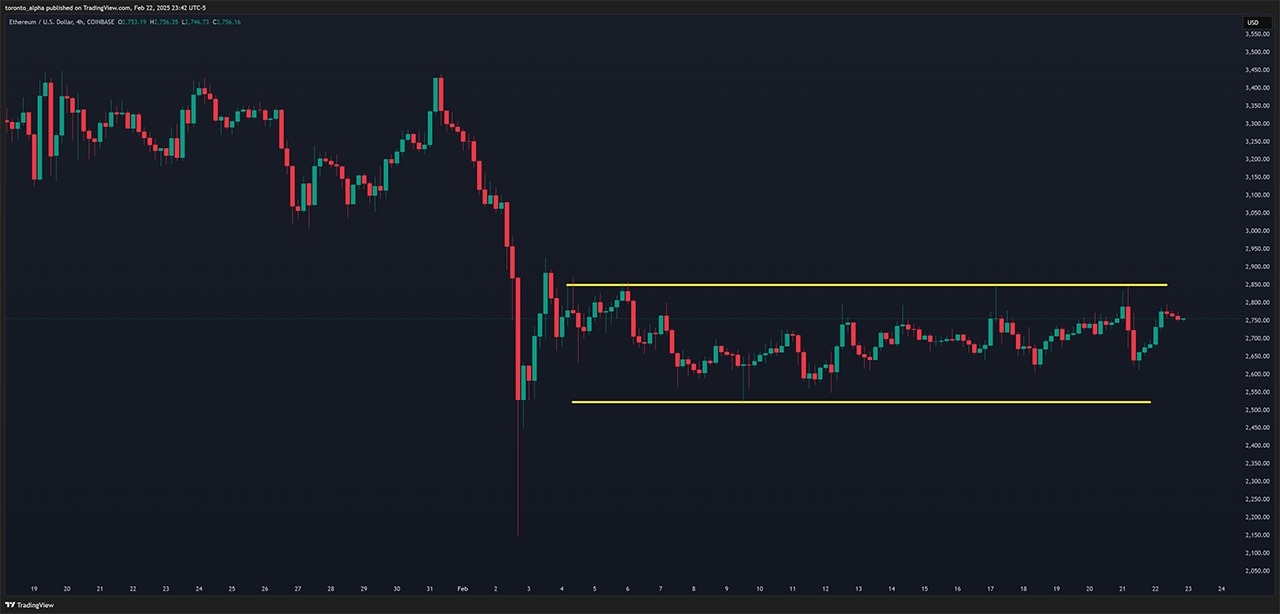
If you think this pattern looks like simple pullback trading on a trend, then you are right. It is precisely that, but with rules:
ABCD Pattern Rules
- The first rule of an ABCD pattern is that the price range and the time taken for the AB move should equal CD. Hence, the move is sometimes called AB=CD. If AB is a 50-pip move and took 3 hours to complete, CD should also be a 50-pip move that took 3 hours to complete. Many traders still consider the pattern valid if CD is an extension of AB, so long as it is not shorter.
- The BC move should be a 61.8% or 78.6% retracement of AB. (78.6% is the square root of the 61.8% Golden Ratio).
- The CD move should be a 127.2% or 161.8% retracement of BC.
The Gartley Pattern
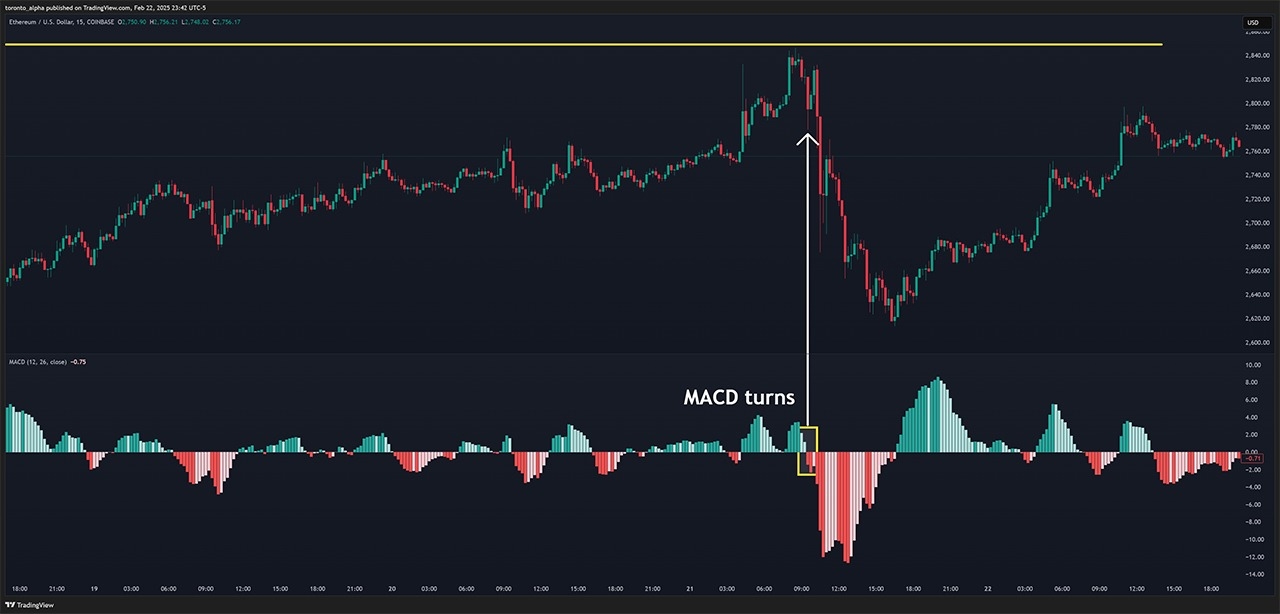
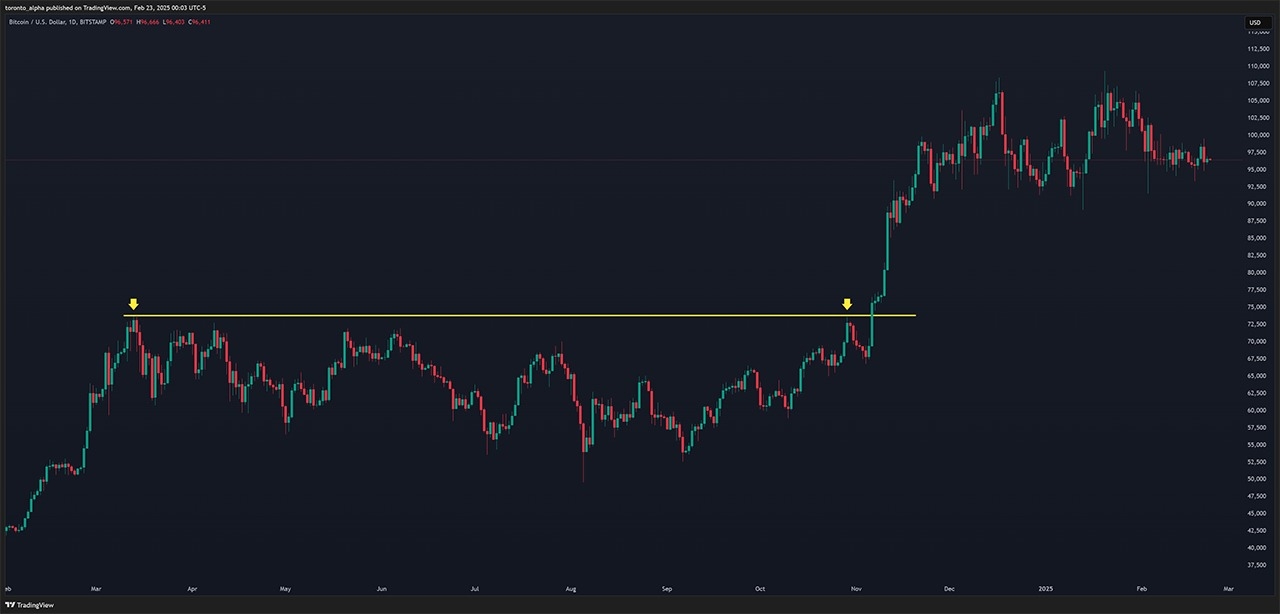
The Garley pattern is the AB=CD pattern with an additional move preceding it, X to A. The ABCD move has the same rules as above, and the move from A to D should be a 78.6% retracement of X to A.
Gartley Harmonic Pattern Rules
- A to D should be a 78.6% retracement of X to A.
- The price range and the time taken for the AB move should equal CD. Hence, the move is sometimes called AB=CD. (The pattern is still valid if CD is an extension of AB, so long as it is not shorter.)
- The BC move should be a 61.8% or 78.6% retracement of AB.
- The CD move should be a 127.2% or 161.8% retracement of BC.
The Bat Harmonic Pattern
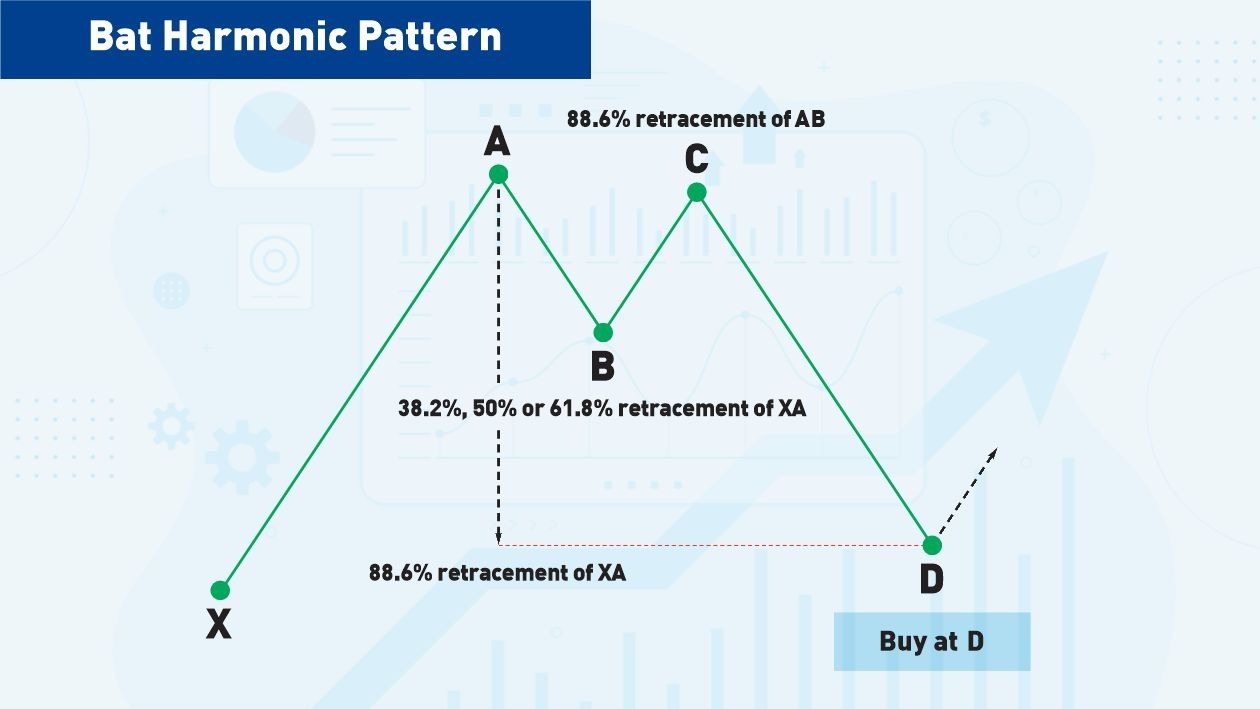
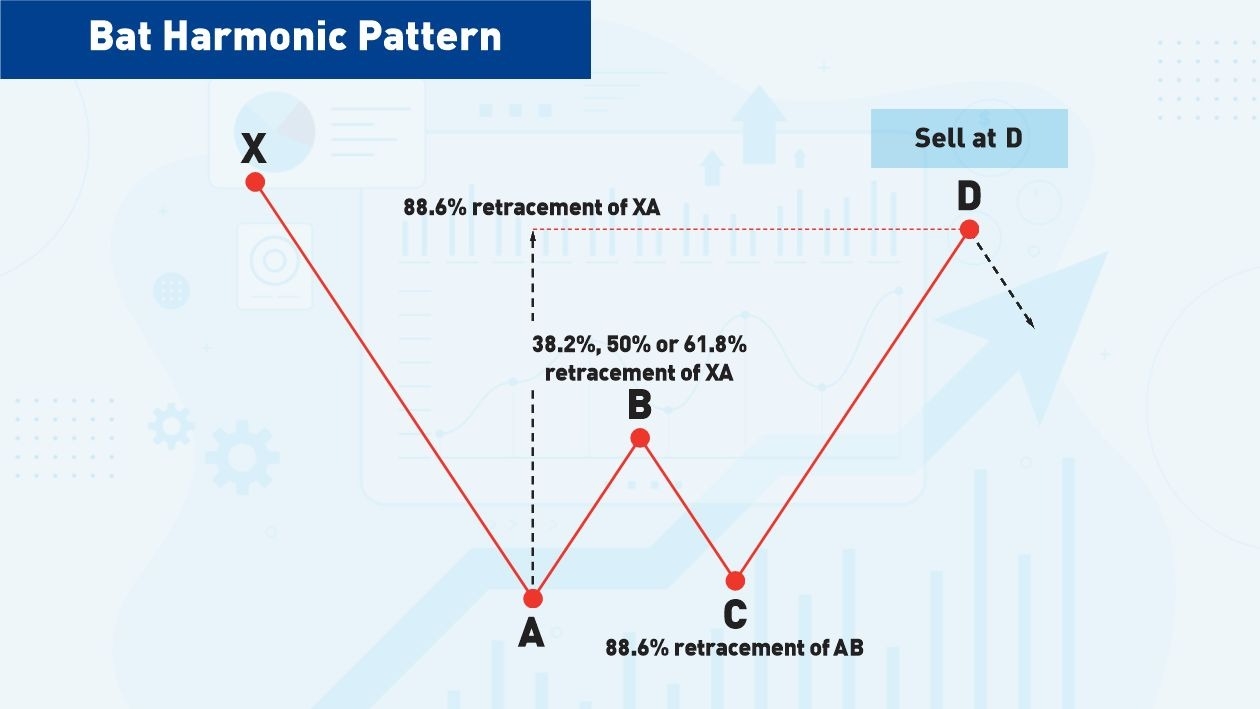
Discovered in 2001 by Scott Carney, the Bat Harmonic Pattern resembles the ears of a bat.
Bat Harmonic Pattern Rules
- B should retrace between 38.2% and 61.8% of XA (ideally 32.8% or 50%).
- BC should retrace not more than 88.6% of AB
- D should finish as an 88.6% retrace of XA
The Crab Harmonic Pattern
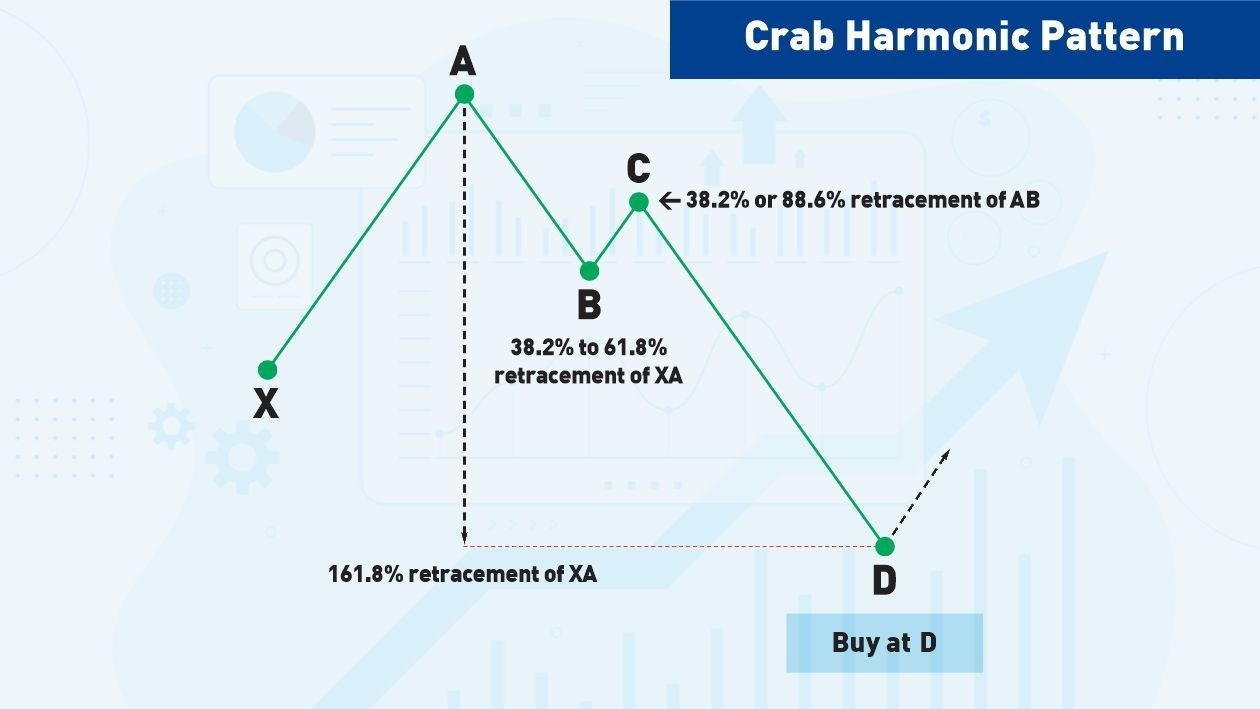
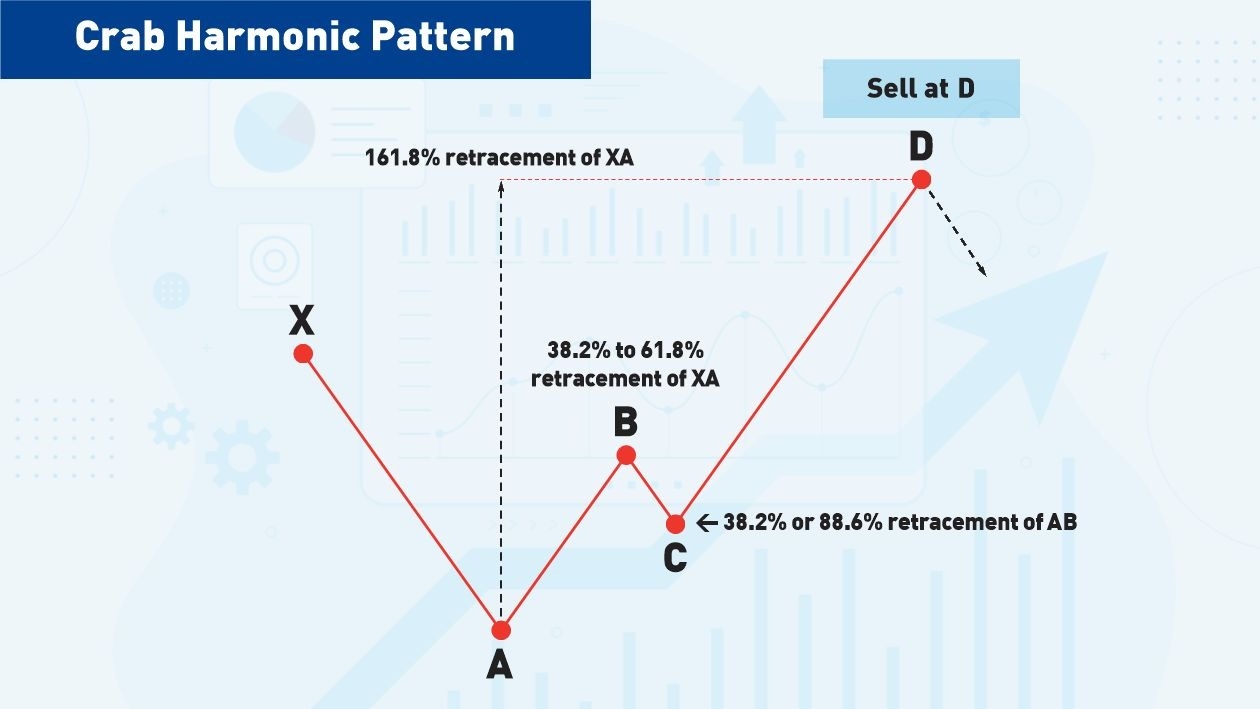
Scott Carney discovered the Crab Patter was discovered in 2000.
Crab Harmonic Pattern Rules
- AB should retrace XA by 38.2% to 61.8%.
- C can be a shallow retracement from 38.2% to a deeper retracement of 88.6% of AB.
- D should finish at 161.8% of XA.
The Butterfly Harmonic Pattern
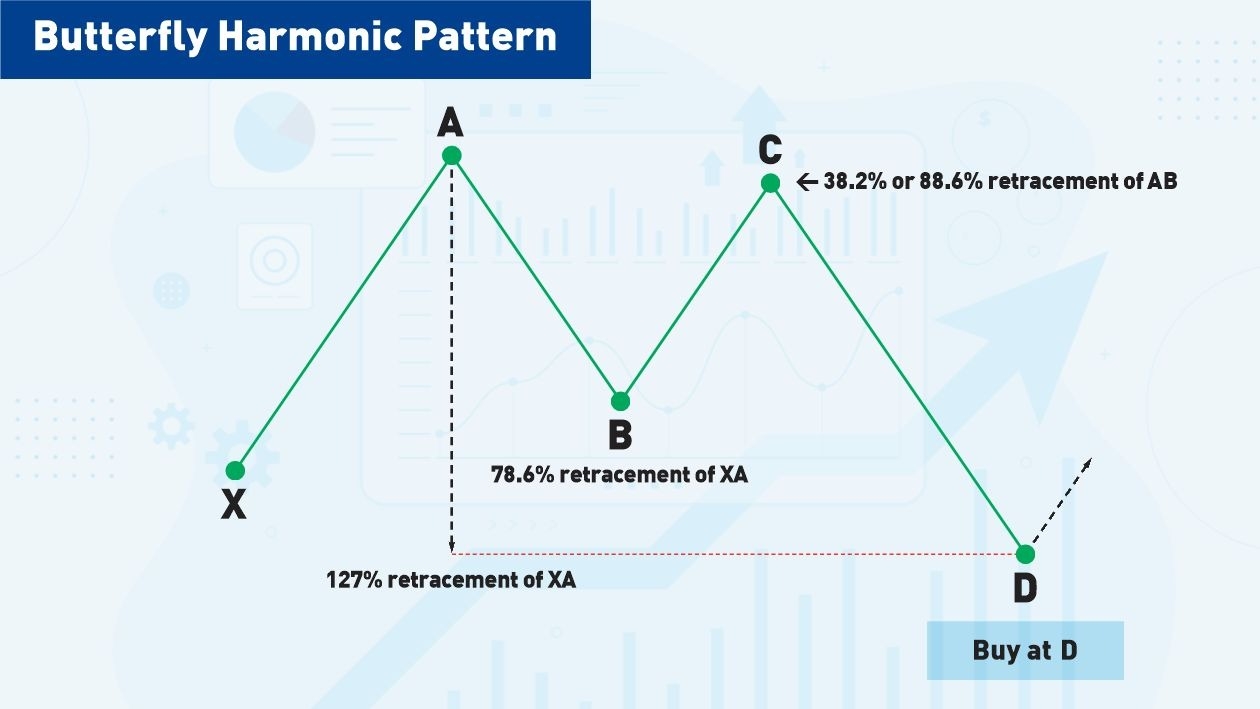
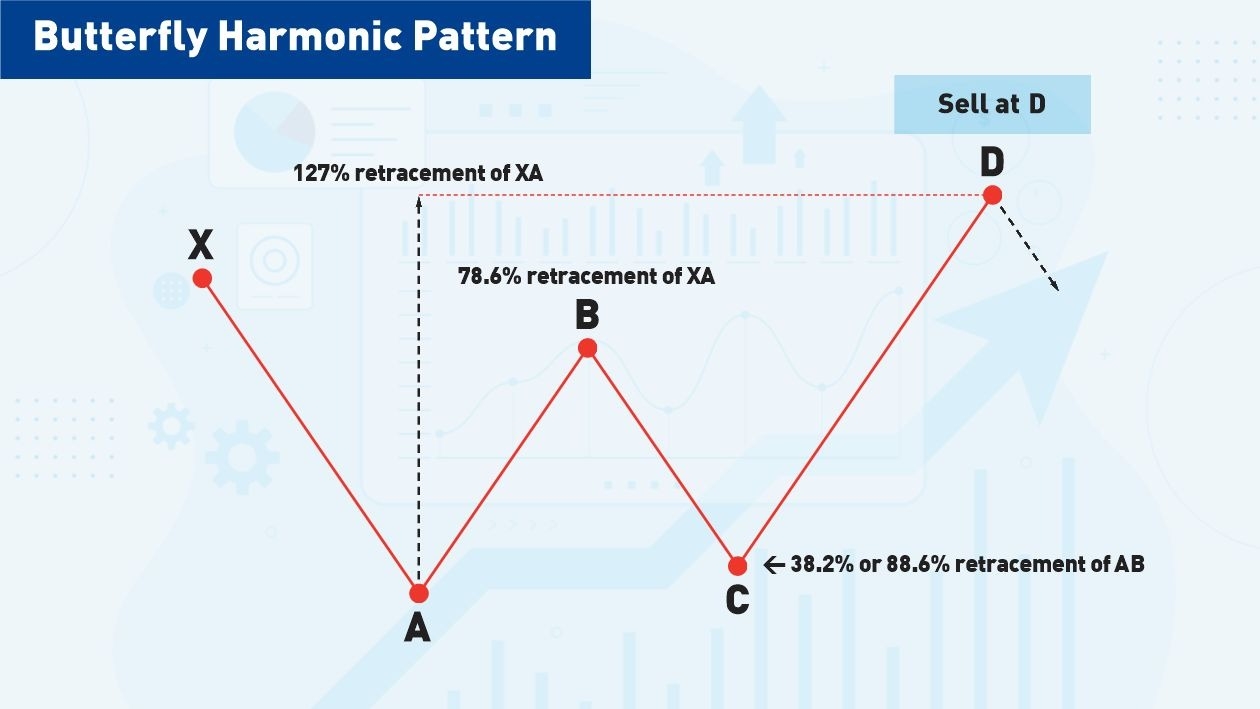
Bryce Gilmore discovered the Butterfly Pattern, and Scott Carney developed Fibonacci ratios around it.
Butterfly Harmonic Pattern Rules
- AB should be a 78.6% retracement of XA.
- BC can retrace from 38.2% to 88.6% of AB.
- D should end at 127% of XA.
The Shark Harmonic Pattern
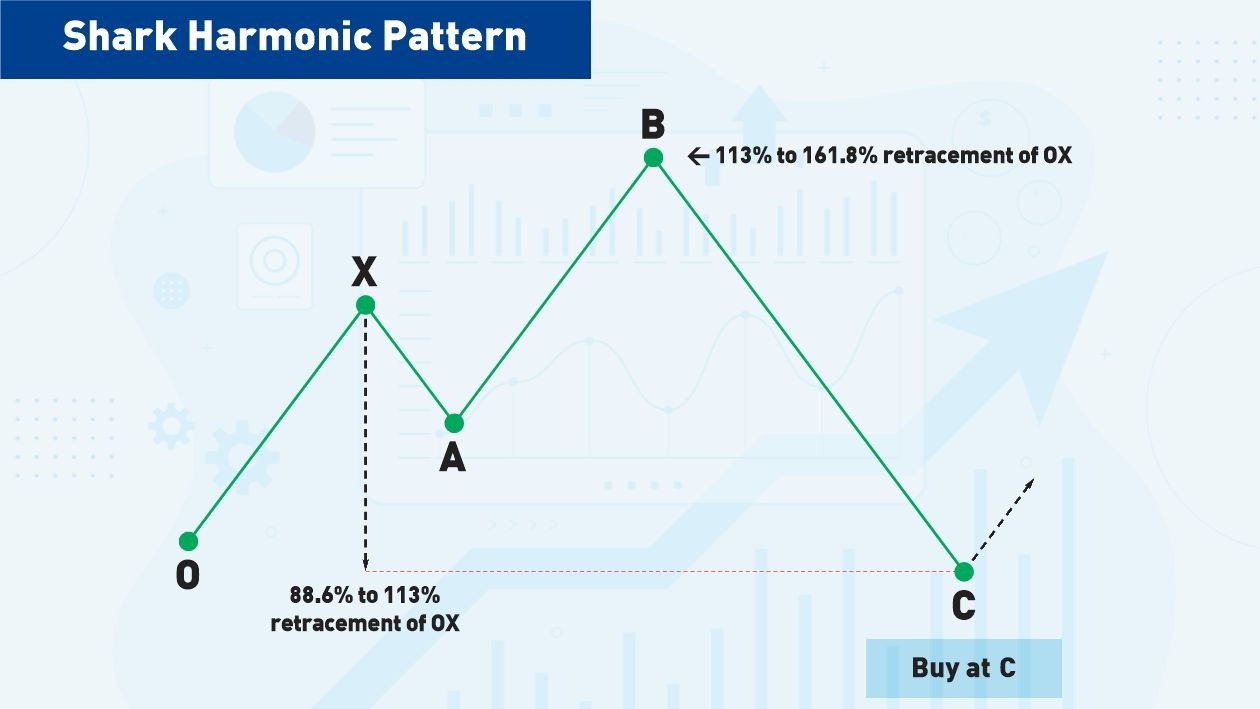
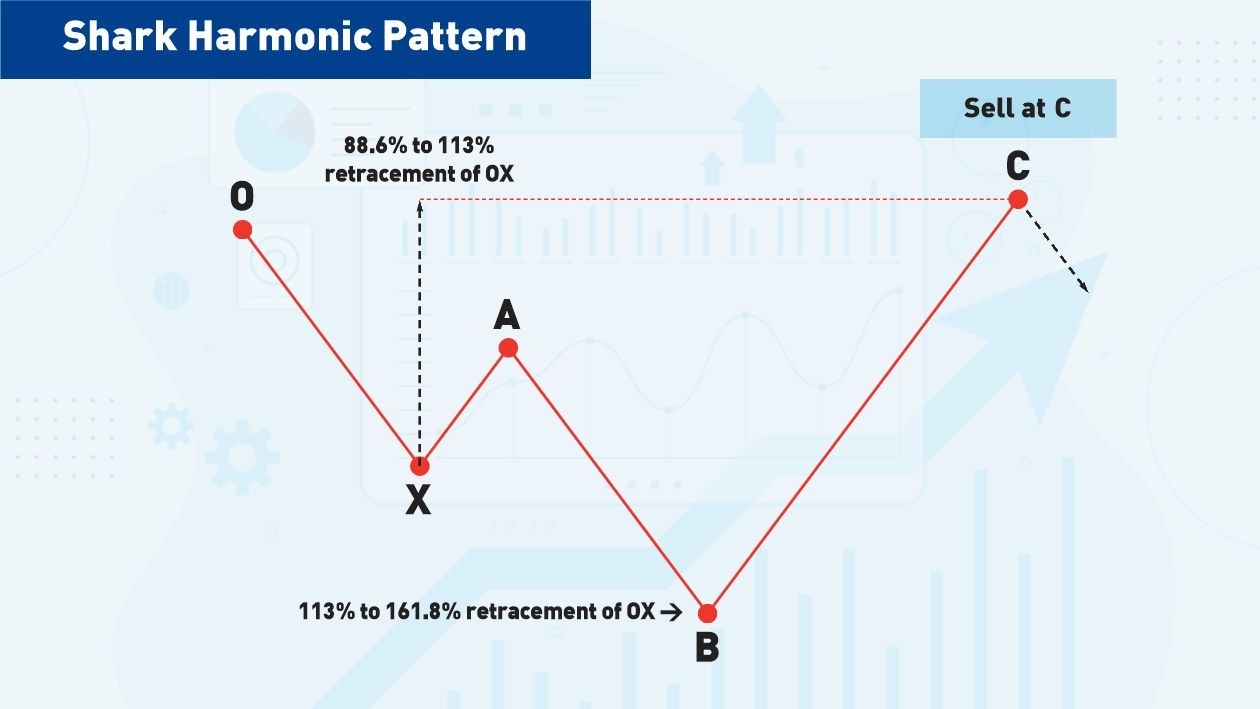
Scott Carney discovered the Shark Harmonic pattern.
Shark Harmonic Pattern Rules
- B should finish between 113% to 161.8% of OX
- C should finish between 88.6% and 113% of OX
The 5-0 Harmonic Pattern
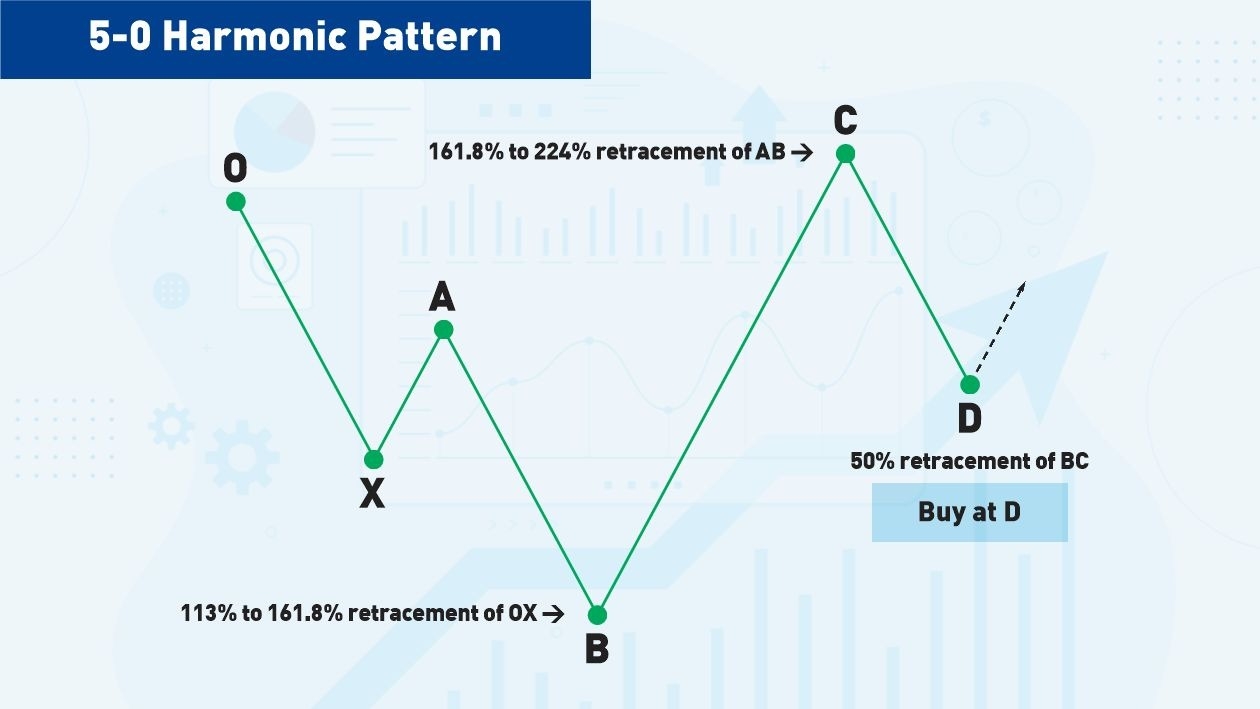
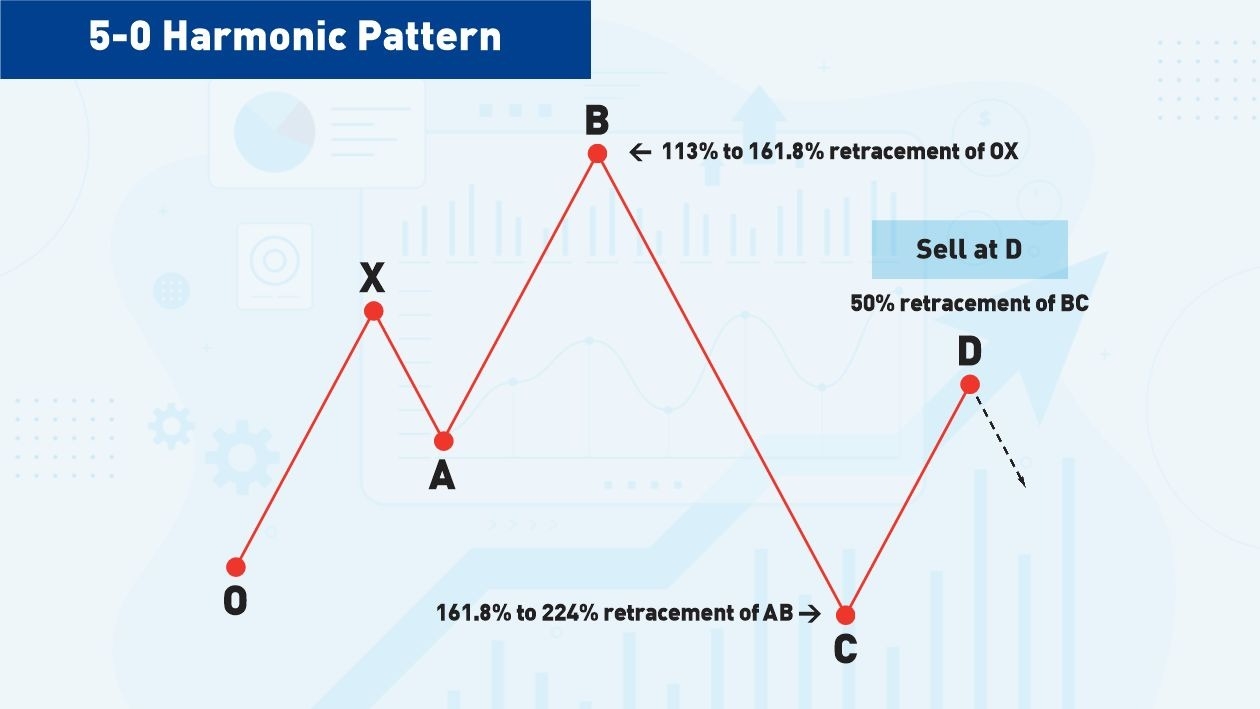
Scott Carney discovered the 5-0 Harmonic pattern.
5-0 Harmonic Pattern Rules
- B should finish between 113% to 161.8% of OX.
- C should finish between 113% and 161.8% of OX.
- D should be a 50% retracement of BC.
How Do I Identify and Draw Harmonic Patterns?
- Mark potential Harmonic patterns on a chart using the line drawing tool on the charting platform. I learned all the basic chart patterns by looking for potential setups on a chart and drawing them.
- Look at examples of Harmonic patterns to help train your eyes. Scott Carney has produced lots of material online, from videos to screenshots and even explaining live trades using Harmonic patterns. These are excellent reference materials for seeing patterns in actual markets.
Understanding the structure of most chart patterns, including Harmonic patterns, does not take long. For example, some of Scott Carney’s videos describing each pattern are as short as five minutes each. Seeing the patterns in actual charts with messy price action requires extensive practice and repeated exposure. So, my answer to the question of how to identify harmonic patterns is practice, practice, practice.
Why Are Harmonic Patterns So Popular in Forex Trading?
- They can be used across any Forex pair.
- They identify natural structures in market movements that have stood the test of time and that traders can use over their careers.
- They are just as valid in smaller timeframes, such as 15-minute charts, as in longer-term timeframes, such as weekly charts.
- They provide an edge to the market that few other technical traders see. Everyone can spot a triangle or double-bottom easily. But it’s not easy to see a Butterfly or Shark pattern. That gives Harmonic traders an edge in profitability.
How to Start Trading with Harmonic Patterns
- I would watch Scott Carney’s or another Harmonic professional’s videos to understand how to trade with Harmonic patterns, especially when they use real market examples.
- Demo trade Harmonic patterns on charts to get comfortable with the setups.
- Consider following a Harmonic trading analysis service to help guide you. I have done that for various areas of technical analysis and found it fast-tracked my development to profitability.
- Programmers have created indicators to help spot Harmonic patterns automatically. These are particularly useful given the number and complexity of Harmonic patterns.
Harmonic Pattern Indicator
Programmers for charting platforms such as MetaTrader MT4, MT5, and TradingView have developed Expert Advisors and indicators that automatically seek and draw Harmonic patterns. These range from basic forex indicators to complete trading systems that can execute trades. Some are free, and others cost a flat fee or subscription.
The indicators are valuable because they do not force me to trade but speed up identifying patterns. I can then examine them to decide if they are strong or weak setups and whether they align with higher timeframes, etc.
Scott Carney, the inventor of many harmonic patterns, has developed software to identify harmonic patterns and provides an analysis service.
Harmonic Patterns—Pros and Cons
Pros
- Harmonic Patterns identify an underlying structure to market movements that have stood the test of time and different markets from Forex to crypto.
- Harmonic patterns work remarkably well on smaller timeframes for which other chart patterns are less reliable.
- They are not easily seen by the untrained eye, meaning those traders who spot them have an edge in the market.
Cons
- Harmonic patterns initially feel incredibly complex and subjective.
- You can invest a lot of time learning how to use them but ultimately decide they are not for you.
Bottom Line
Harmonic patterns are price-based chart patterns that incorporate Fibonacci ratios in their structure. Traders can identify them by looking at charts and drawing potential setups by hand, or by using indicators to help identify them automatically. Because Harmonic patterns are more complex than traditional patterns, many traders use software to help spot them on charts. Harmonic patterns began with H. M. Gartley’s work in the 1930s and his Gartley Pattern, culminating in today's patterns with developments by Bryce Gilmore and Scott Carney. The patterns are challenging to learn, but for many, the investment in time is worth it, for the profitability they deliver.
