What is the Triple Screen Trading System?
As you might expect from the name, the Triple Screen Trading System works with a composition of three diagnoses for the same asset. It looks for short-term reversals about to end inside long-term trends in order to open positions in the dominant movement's direction at the right time.
The system is based on Elder's hypothesis that no single indicator can provide reliable signals or position plans. So, the triple screen is a mix of technical studies in different timeframes that proves one parameter each time, that when combined, offers an accurate trading signal.
The triple screen system works with a trend following (momentum) indicator on the first screen, such as a simple moving average. It confirms the dominant trend that the asset is developing and the direction your position will need to be taken in.
The second screen works with an oscillator, for example the stochastic oscillator indicator, which helps us to identify turning points and entry areas. Every time that a pullback or a retracement occurs, it will give us an area to be ready to place our position.
The third screen works as an identification for the exact price for entry points. In the original system, it works with lows and highs that work as support and resistance. New versions typically add other indicators but using the naked eye to spot price action here is a completely acceptable method.
Essentially, in using this triple screen trading system, you look at the bigger time frame chart for direction and the smaller time frame chart for entry points when trading the triple screen strategy. After a trade entry is taken, the position will hopefully then move in line with the dominant trend.
Top Regulated Brokers
How Does the Triple Screen Trading System Work?
Elder’s system can work for both long and short-term traders. The only thing choices you really need to make are which time frames and indicators to use for the screens. The largest time frame will be the first screen.
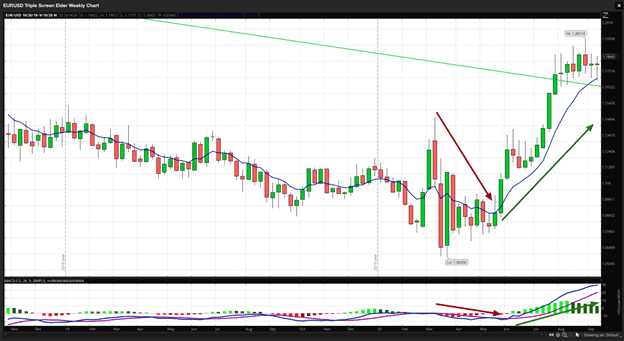
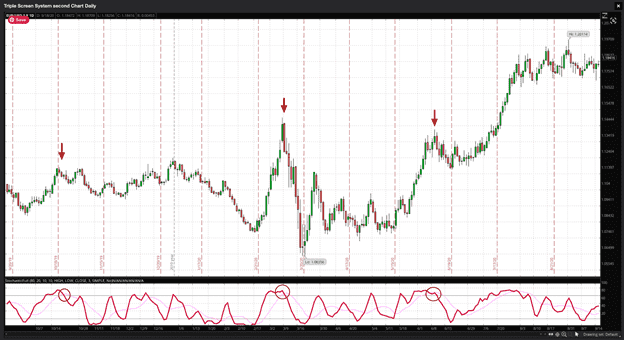
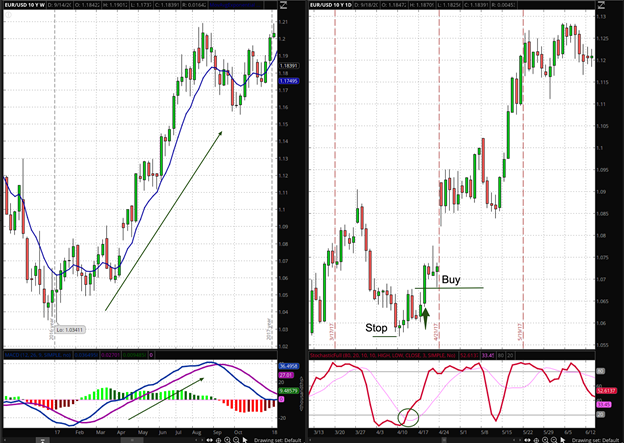
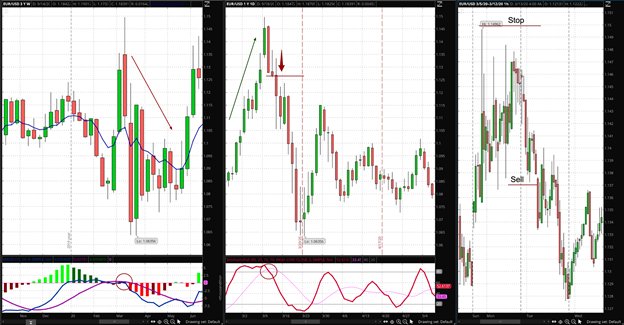
Samples of typical charts used in this triple screen trading system are shown below.

If you are a long-term trader, your first screen or long-term trend will be the weekly chart, the intermediate is the 1-day frame, and the third screen will be placed either in 4-hour or 1-hour charts.
In the case of short-term traders with a preference for 1-hour charts, the first screen will be the daily chart, the intermediate will be the 1-hour obviously, and finally, the third screen would be the 15-minute timeframe.
The weekly chart will confirm the direction of the trend, the second will show you the currency pair's current situation, and the third will give you the entry point for your new trade.
Alexander Elder's First Screen
Let us use a triple screen in Forex trading with the EUR/USD currency pair as an example. This is the screen used to identify the dominant trend in the asset and to decide in which direction we will make the trade.
First, watch the chart. If the EUR/USD is trending up, we will identify buying opportunities; on the other hand, if trending down, we would seek to sell the EUR/USD.
For this, we will use a weekly chart with two trend indicators, an Exponential Moving Average (EMA) with 13 periods, and a Moving Average Convergence Divergence indicator (MACD) with 12,26,9 settings.
The next step is to try to identify MACD movements away from the zero area. If the MACD is moving upward after crossing the zero area, it will be an uptrend. If MACD is crossing down from the area above zero, it will be a downtrend. The EMA will confirm the direction of the tide too.

Elder's Second Screen
Once we have identified the trend's direction, we then switch to watching the second screen. This chart will help us identify the short-term situation and know when the dominant trend is ready to resume its run after a pause.
The first step is to identify short term reversals that are exhausted or finished. It would be a contrarian movement from the long-term trend or a smaller trend that goes in the opposite direction of the dominant one.
For this purpose, we will use the stochastic oscillator. Dr. Elder also recommends the Relative Strength Index (RSI) and William %R. You can choose your favorite one.
The second step is to identify the break. This signal will appear when the stochastic leaves the overbought or oversold areas and returns to more median values in the center of its range.
When reading stochastics, we follow the K line and the D line. The K line is faster than the D line. You should identify when the D line moves into overbought, over the 80 line, or oversold, under the 20 line.
The trigger would occur when the D line enters overbought or oversold conditions; it will show us a direction change. Your confirmation will be at the moment the D line crosses the K line.
Finally, you would go short when the stochastic is returning from overbought conditions. On the other hand, you would buy the asset when the indicator is returning from an oversold area.
Now, you have a dominant trend identified and have identified the exhaustion of a reversal against that — the time has arrived to try to determine a precise entry point.

Elder's Third Screen
After identifying the dominant trend in the first screen, and getting a signal from the second screen, we move to the third screen. It will provide us with precise entry points.
In the third screen, you should ideally look for breakouts in the direction of the dominant trend. Elder uses a technique of trailing stops to determine specific entry points.
For example, if we are looking for bullish entry points in a daily chart used as our intermediate screen, we would use a trailing buy stop one point above the previous day's high.
On the other hand, if we are looking for a selling entry point, we will use a trailing sell stop one point below the previous day's low.
The theory says that if the market retakes its uptrend and hits your stop, your long position will be activated. However, if the market goes against you, then your stop will be deactivated.
In that case, you can trail your stop and set a new one by dropping it to one point above the maximum of the day that has just passed. According to Elder’s rules, you may keep trailing it until activated or until you decide to avoid the trade if you see the weekly trend has changed its direction.

On the other hand, if we identified a dominant downtrend and watched a mid-term uptrend, the sell order will be placed one point below the low of the previous period from which the oscillator activated the signal. The stop-loss is then placed behind the two-day high price.

Finally, the moment to take profits will be determined by your trailing stop once you are in a position. You can set it to protect 50 percent of your running profits or, in the case of shorter time frames, a fixed pip value should work just as well.
Another way to determine your profit taking level is to watch for oversold levels when you are short, and overbought levels when you are long and, therefore, when the oscillator begins to return to a normal level, exit the trade manually.
According to Dr. Elder, the third screen does not need a separate chart or an additional indicator. You can trade the Elder triple screen strategy with only two screens, after all!
Alexander Elder Trading Strategy: Summary

Does the Elder Triple Screen Trading System Work?
Dr. Alexander Elder's work has been trusted by thousands of traders around the world. It has been used millions of times since its publication in 1986, over 30 years ago. So, statistically speaking, yes, it has been found to “work” by traders. There is also evidence that following long-term trends in major Forex currency pairs has been a profitable trading strategy, and this is how the Elder triple screen trading system works.
Before you start to use this trading strategy, it is recommended to test it in a demo account and then a real money account provided by one of the best Forex brokers. You can also try to add another indicator or charting figure in the third screen in order determine more precise entry points.
Finally, keep in mind that the markets evolve every day, and situations and the environment can change any second. Keep an eye on fundamental data and pay attention to market sentiment, too.
Remember what Elder said in his book, The New Trading for a Living, "there are good trading systems out there, but they have to be monitored and adjusted using individual judgment. You have to stay on the ball—you cannot abdicate responsibility for your success to a mechanical system."
