Identifying a wedge
The first thing that we need to do is identify what a wedge actually is. A wedge is simply two trendlines that converge towards an apex. In other words, price is compressing from both selling and buying pressure. It is like a triangle but does not converge in a horizontal manner. In other words, you may have an uptrend line as per usual, but at the top of trading during the last several candlesticks, the sellers are becoming a bit more aggressive, compressing the market. If there is an uptrend line, the wedge formation is known as a rising wedge. Compression is something that should always be paid attention because markets will not compress forever, and eventually inertia comes back into play.

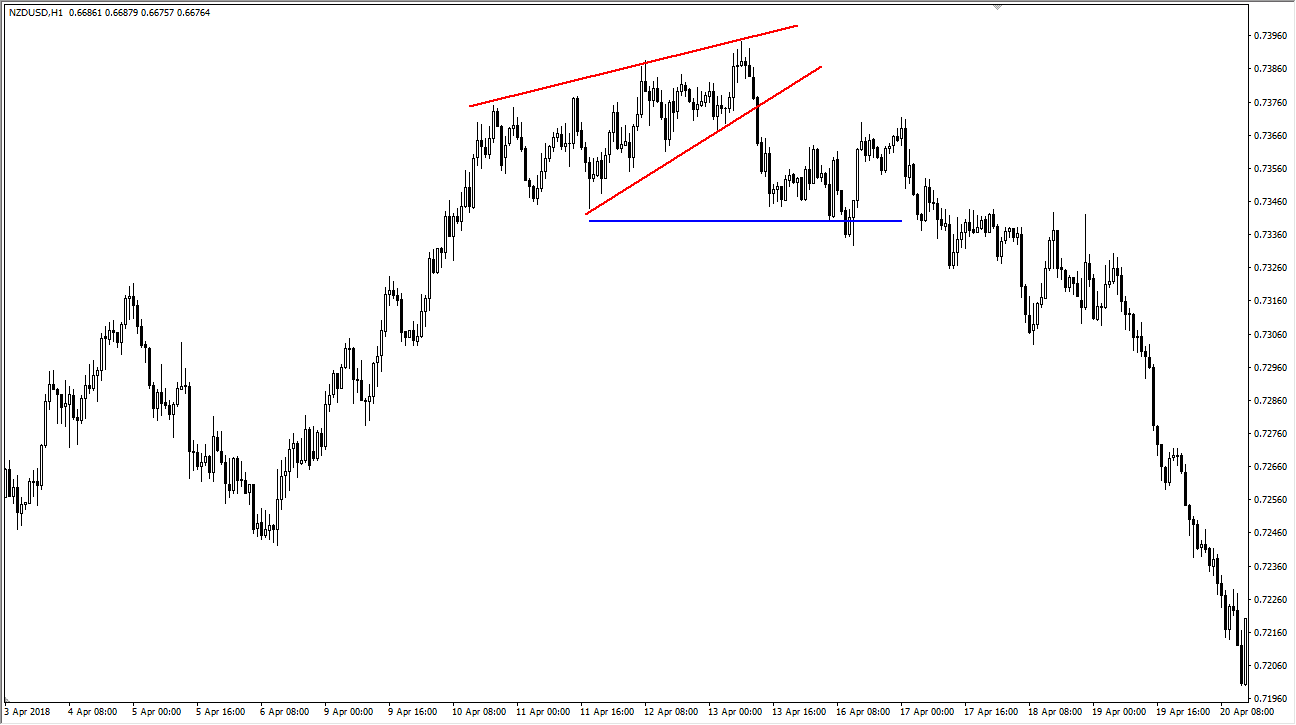
In this chart, you can see that the New Zealand dollar has been rising for quite some time, and the red uptrend line shows where there was support on the last move towards the top of the chart. However, you can also see that the sellers were becoming a bit more aggressive, compressing market action on the way up. The highs were getting higher than the ones before but slowing down in terms of momentum. The two red lines show what a rising wedge looks like.
In this example, it is what is known as a “rising wedge.” A rising wedge shows compression in and uptrend that signals that there could be something wrong. We are losing some of our momentum, and as a result the highs just are not as impressive as they once were. The beauty of this pattern is that a break down below the uptrend line signals that we are going to the bottom of the pattern itself, denoted by the blue line. Beyond that, what is even more important is that at the very least most traders around the world will see that the trend line had been broken. So even if they are not trading wedge patterns and are ignoring this current rising wedge, almost all traders pay attention to trendlines. When they get broken, they catch everybody’s attention.
The stop loss would be placed on the other side of the rising wedge pattern, and in this case, it is an easy 1:2 risk to reward ratio. By paying attention to the rising wedge, you are noticing that the market is running out of momentum, and that an eminent reversal may be coming.
Wedges appear in all time frames
Wedges can appear in all time frames. While quite often traders will use them on shorter-term time frames, the reality is you can see them on a daily and weekly charts as well, and I would even argue that perhaps they may have a bit more potency and importance built into him on these higher time frames, because it takes much more effort to form the pattern to begin with.
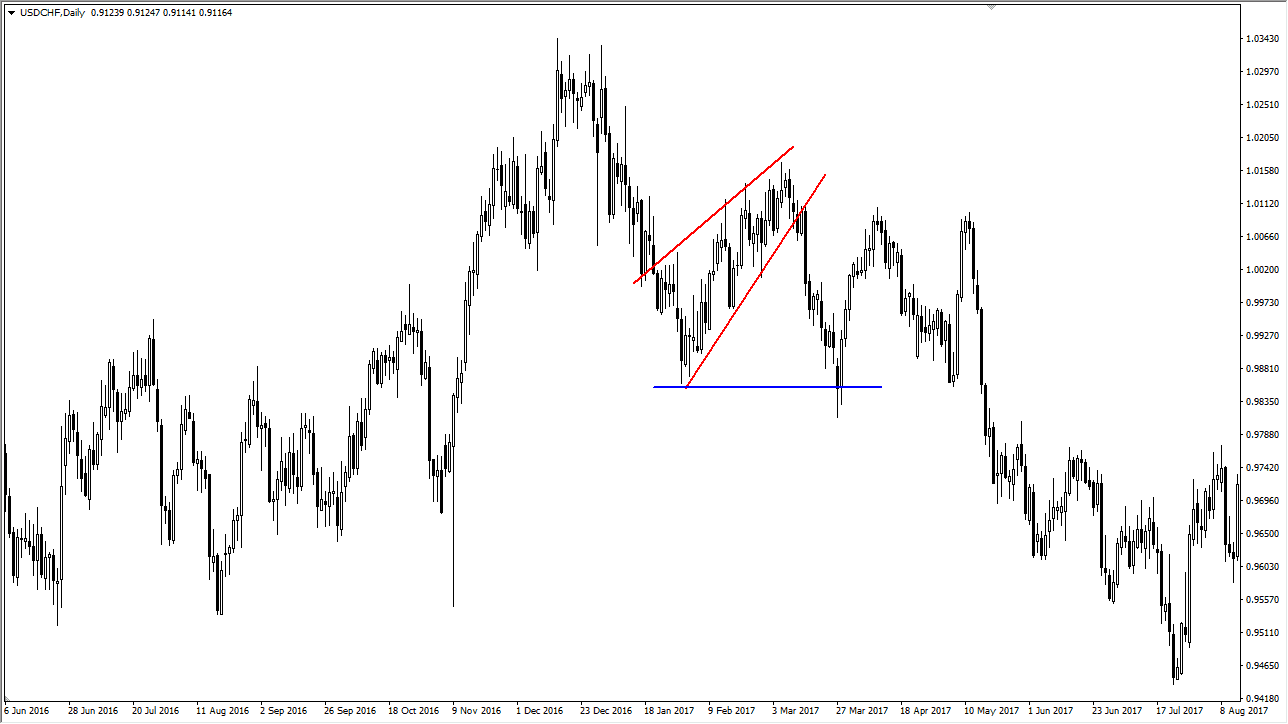
In the example below, take a look at the US dollar/Swiss franc currency pair. You can see that the market had been rallying during the months of January, February, and March of 2017. As soon as the market broke down below the uptrend line of the rising wedge, it was relatively quick to reach towards the target of the bottom of the pattern itself. The stop loss that would have been placed above the top of the rising wedge was never even remotely threatened, and you can see we not only hit the target, but bounced back towards the break down again, and then hit the target two more times during the spring and early summer.

Wedges can be bullish as well
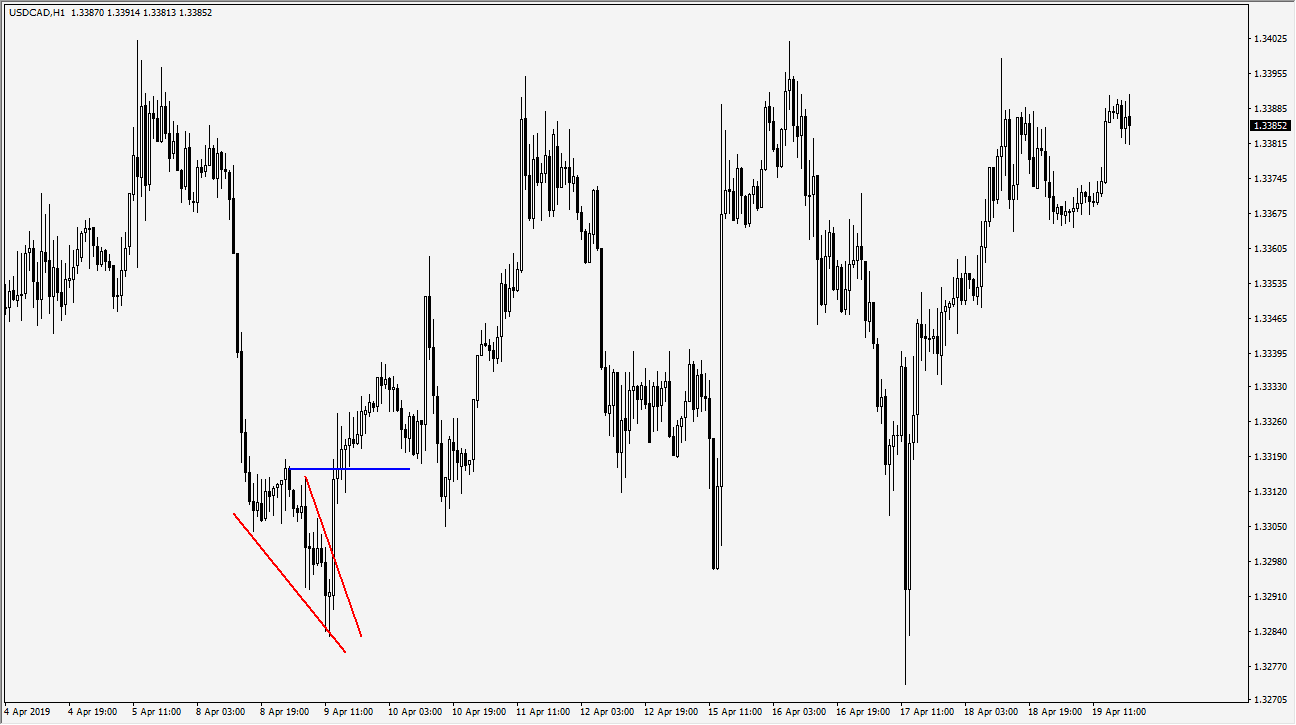
Like almost all chart patterns, there is the opposite of the rising wedge as well. In this case, you are talking about the “falling wedge.” As you can see on the chart below, the US dollar had been falling against the Canadian dollar quite sharply, and then drifted a bit lower. Notice that the trajectory of the lows was not as strong as before, and then of course the highs were becoming as aggressive as well.

As you draw the two trendlines, you can see that a wedge is most certainly forming. Beyond that, we reached the blue line which represents the top of the wedge almost immediately on the breakout. The stop loss would have been on the other side of the wedge, which also would have been supported by the hammer that made up the last candle of the wedge before the breakout. If you look forward several days, you can see that the same area offered support on a pullback at least twice. This is quite common when it comes to market patterns, as it is a phenomenon known as “market memory”, which is where support becomes resistance in vice versa. This is because of those who have missed the initial move or wanting to get in and take advantage of what seems to be a change in direction, and of course those who are on the wrong side of the trade are happy to get out at either breakeven or something close enough to it in order to protect their trading capital.
Time and price are two different things
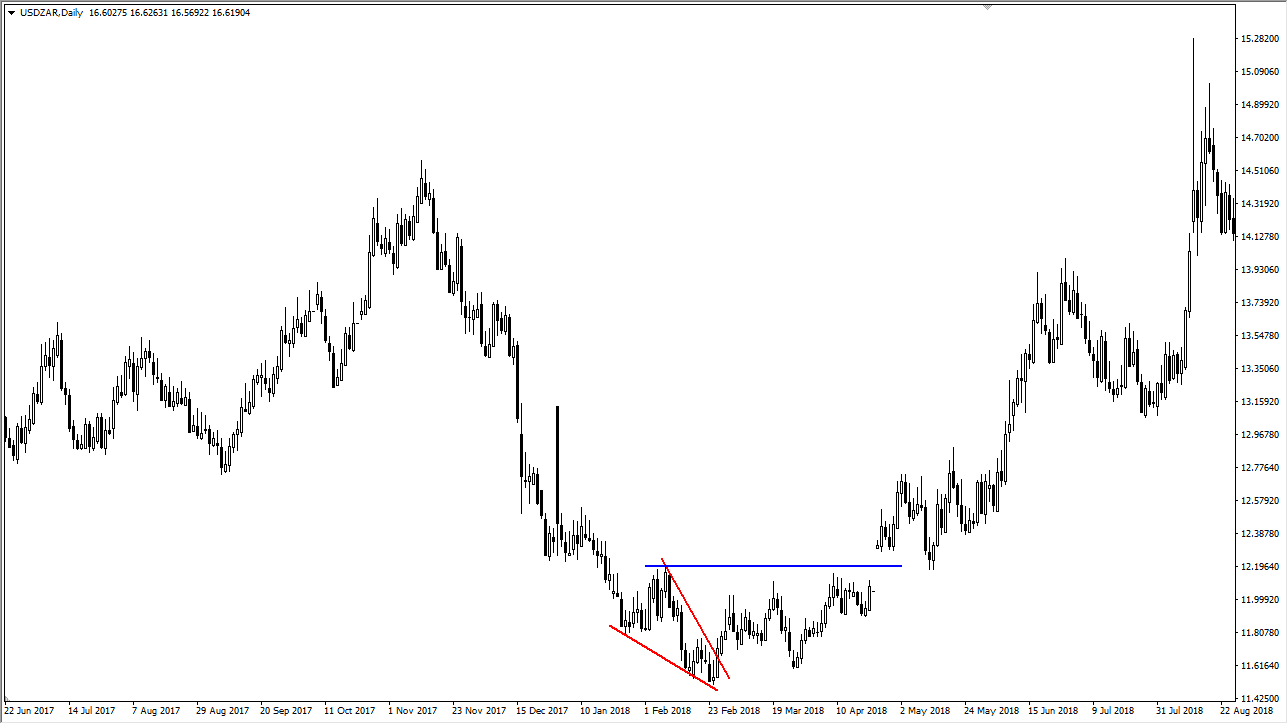
One huge mistake that a lot of traders make is that they get concerned when a trade does not go in their direction or hit their target right away. Remember though, time and price are two totally different things and even if you do have a trade workout, it will work out on whatever the market schedule is, not yours. In the example just below, you can see that wedges appear not only in all time frames, but they also show up in emerging market currencies as well. The US dollar/South African Rand currency pair formed a falling wedge in February 2018, and then rallied after we broke through the downtrend line. Notice however, the market had to make several attempts to finally reach the target which was in fact had via a massive gap higher. Notice that the market pulled back later during the month of May, and tested that blue target line, even though it did not fill out the gap on the pullback. In other words, the falling wedge was still showing its influence. While the market certainly took its time, the stop loss underneath the wedge was never remotely threatened.

Yet another way to trade charts
Wedges are simply another tool that you can use to trade your charts. Wedges are fairly common, and also represent trendline breaks, so even if your competitors are not paying attention to wedges, they most certainly are paying attention to those trendlines as that is about as basic as it gets. This is why wedge patterns are so potent. Furthermore, it has the added benefit of having a “built in measuring stick” in order to place your target. If you are a systematic and mechanical trader, this has multiple advantages as you can simply buy or sell based upon the break of the pattern and aim for the other side of the pattern as prescribed by the usual conventions. This takes a lot of the guesswork out, and it is a trusted pattern that many traders have used through the years, meaning that we simply use the typical rules with any filters that you may choose in the form of oscillators, moving averages, etc. in order to play the market.
FAQs
What does a rising wedge mean?
A rising wedge is a technical price chart formation produced by two non-symmetrical trend lines which produce an ascending shape between the trend lines.
Is a rising wedge bullish or bearish?
A rising wedge formation is bearish if the lower trend line gets broken.
How do you trade a rising wedge?
Wait for the lower trend line to be broken then enter short, targeting the swing low of the broader technical pattern which produced the wedge formation.
Is a wedge bullish?
A wedge may be either bullish or bearish depending upon its location within the longer-term price chart pattern.
