Technical traders tend to turn to a handful of trading patterns repeatedly. Undoubtedly, one of the most common is the head and shoulders pattern. However, there are a couple of factors to remember before using it.
Firstly, while nothing is 100% guaranteed, a comparatively obvious pattern, like the head and shoulders, will attract more flow as everybody else sees the same thing. Think of it this way: if everybody in the market sees a potential buying or selling opportunity, it makes sense that many traders will follow it.
Defining the pattern
The first thing that we need to do is to identify the pattern. The head and shoulders pattern features three parts: the left shoulder, the head, and the right shoulder. It is a pattern where you get a high that forms, a pullback, a higher high, and then a low or high. In other words, the third part of the pattern, the right shoulder, is a lower high from the head.
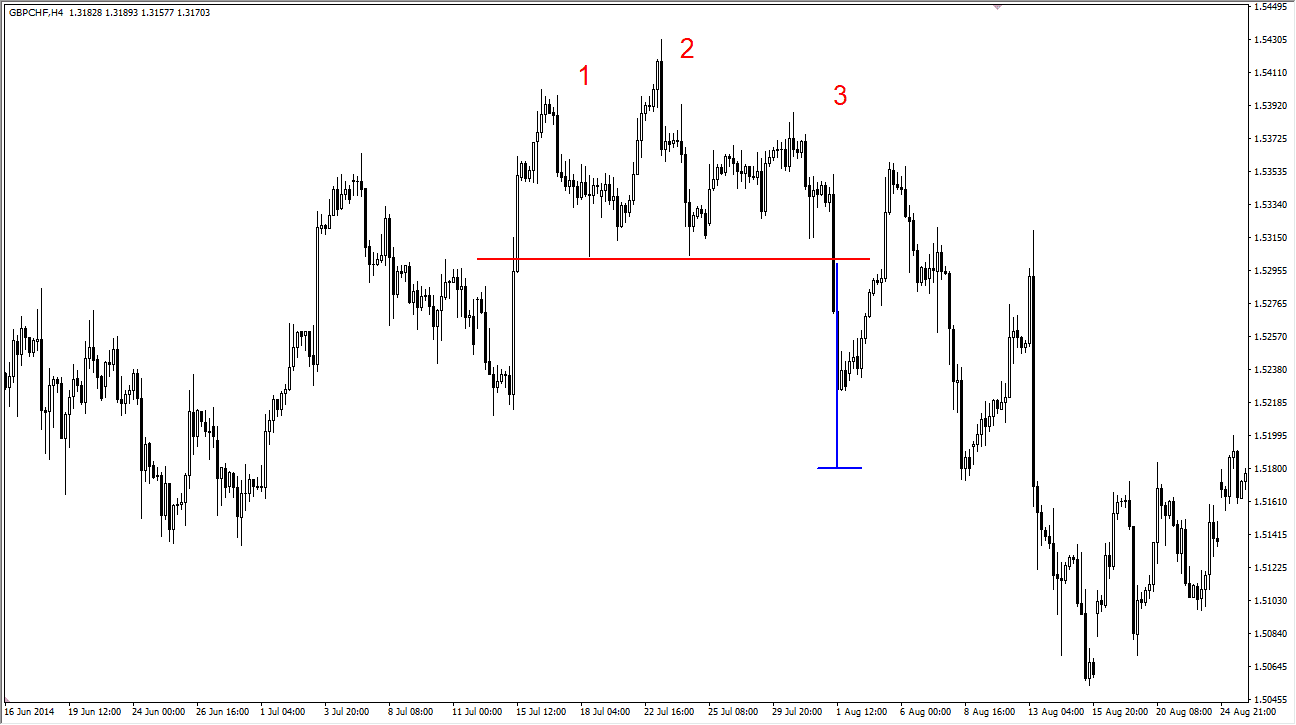
Take a look at the GBP/CHF four-hour chart just below. It is an example of what a head and shoulders look like. The high, labelled "1", is called the left shoulder. The second peak that is marked "2" is the head. And then finally, the third peak, labelled "3", is what is known as the right shoulder. What this represents is an uptrend that is running out of momentum.
I would also point out the red line underneath the three humps that make up the pattern. This is known as the "neckline" and is the trigger to start selling. Once we break down below that level, everybody in the previous three waves higher is now underwater and will have to sell their positions to exit the market. That presents an opportunity as it pushes even more downward pressure into the marketplace.
Notice that the blue line extends lower from the neckline and down to an area that was eventually hit. That is the target. How does the pattern suggest a target? It is simply a measurement from the top of the head down to the neckline. In other words, if the head and shoulders pattern is 300 pips tall, on a break below the neckline, we should see a move of 300 pips from that point. In this example, you can see that we broke down significantly, bounced back into the pattern, and eventually hit our target. As a side note, many traders will use the right-hand shoulder as a place above which to put their stop.
Inverse Head and Shoulders
Not all head and shoulders patterns need to be negative. As with many chart patterns, there is an inverse pattern. As the name suggests, an inverse head and shoulders mirrors the regular pattern and emerges following a downturn. It is indicative of a change from bearish to bullish sentiment.
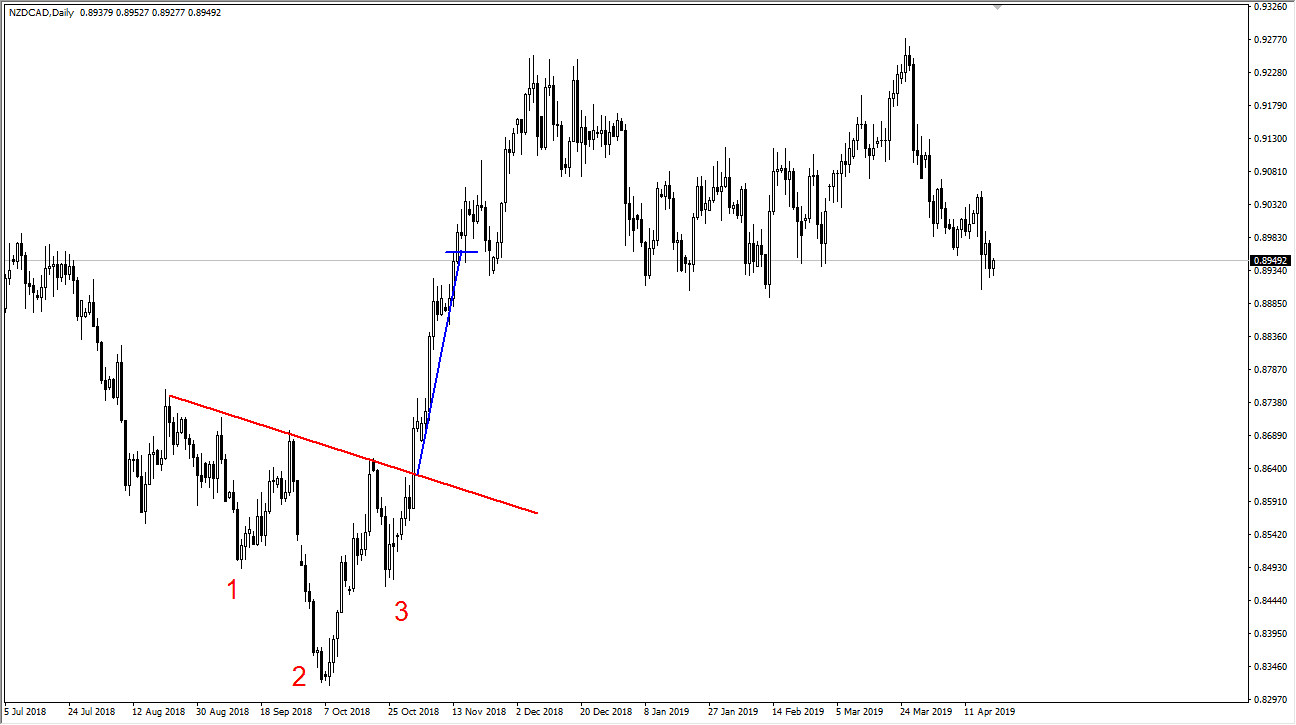
This is a series of three lows, starting with the left-hand shoulder being a bounce back to the upside, then a breakdown to form the head, a bounce back to the upside, and then a higher low, creating the third shoulder. Simply put, it is an upside-down head and shoulders pattern. This means the sellers are running out of momentum, and the market could rally significantly. In this scenario, you should buy when the asset price breaks above the neckline after the right shoulder. Stop losses should be placed below the right shoulder’s low.
Look at the following chart and see how this works in an inverse pattern. You should recognize that it is the same thing, only turned upside down.
An Addition to Your Trading Toolbox
The head and shoulders pattern is another tool you can put in your trading toolbox and is used by enough traders that it tends to be a self-fulfilling prophecy. Nothing works 100% of the time, but one thing that can help you is to focus on higher time frame head and shoulder patterns because they take much more volume and trade action to form. In other words, many more people will pay attention to them because they take much more effort to form.
Remember, simplicity is one of the hallmarks of a good trading system if you need other people to move right along. These obvious patterns are helpful because you can have the rest of the market pushing in the same direction.
How to Trade the Head and Shoulders Pattern in Forex
In forex, the head and shoulders pattern emerges following an uptrend, and the trader needs to sell when the currency pair price breaks the neckline once the right shoulder has formed.
However, forex has some unique characteristics which will impact how the pattern is traded. Forex is a 24-hour market, so how the pattern forms will vary across different trading sessions. In addition, forex trends heavily, so a pattern reversal could have a much more significant impact, meaning risk mitigation is critical. Also, position size should be closely managed, as in Forex; using leverage can increase profit potential but can equally increase your exposure.
Placing the Neckline
A neckline is drawn on a head and shoulders pattern by connecting the lows of the two shoulders, and it can be angled up, down or horizontally. Hold out for a confirmed break, signalling the pattern is complete, and sell under the neckline. In an inverse head and shoulders pattern, draw the pattern across the highs and buy on a break above the neckline.
Placing Your Stops
As with any trading pattern, when using the head and shoulders, you want to protect yourself if the pattern fails. To achieve this, place the stop loss above the height of the right shoulder as soon as the neckline is broken. When it comes to an inverse head and shoulders pattern, the opposite is required, so after the neckline breakout, you need to place your stop loss below the low of the right shoulder.
Setting Your Profit Target
To effectively set your profit target using the head and shoulders pattern, calculate the distance from the head to the neckline and then project that distance beneath the neckline breakout. In the case of an inverse head and shoulders pattern, you need to project the distance from the head to the neckline above the neckline breakout.
Take partial profits as you go and move your stop loss to breakeven at your chosen target price.
Pros & Cons of Using the Head & Shoulders Pattern
There are some unique advantages to using the head and shoulders pattern.
Pros:
- A head and shoulders is a great indicator of a trend reversal
- This pattern is comparatively easy for traders at every level to identify on charts
- When used correctly, this pattern has a success rate of approximately 70%
- When confirmed, a head and shoulders pattern presents a high probability setup
- This pattern has clear, straightforward entry, stop loss, and take profit levels
While there are many benefits to using the head and shoulders pattern, some drawbacks should be considered.
Cons:
- The pattern is not foolproof, as there can be false breakouts
- You are at risk of being stopped out if you place a stop loss above a right shoulder
- In choppy and ranging markets, head and shoulder patterns are less reliable
- The pattern can be countered by fundamental news, preventing it from working
- Inverse patterns and other complex iterations are difficult to trade
- This type of pattern requires confirmation before entry
Bottom Line
The head and shoulders chart pattern signals a change in momentum and a shift in market sentiment from bullish to bearish. It offers a straightforward reversal strategy that traders can effectively implement at every level of skill and experience. Using this strategy, the head is the highest peak of the trend, with the shoulders as lower peaks on either side. You should go short when the price breaks below the neckline, which connects the lows of the two shoulders. Stop loss and take profit orders should be set, which will be determined by the pattern measurements.
FAQs
What does head and shoulders mean in forex?
In forex, head and shoulders are a reversal chart pattern, in the shape of two small peaks with a higher one between them. This pattern signals a shift from a bullish trend to a bearish one.
How do you trade head and shoulder patterns in forex?
In forex, a head and shoulders pattern is traded by selling where the price breaks beneath the neckline support after the right shoulder has formed.
What is the head in forex?
In forex, the head is the highest point in the head and shoulders trading pattern. It signifies the height of the previous uptrend.
What is the success rate of head and shoulders trading?
When head and shoulders trading is done right, a success rate of approximately 70% can be achieved.
Which timeframe is best for a head and shoulders pattern?
The best timeframe for a head and shoulders pattern is the 4-hour chart since it provides enough time for the pattern to form while still allowing for fast identification.
Why is head and shoulders so effective?
The head and shoulders pattern can be effective because it signals a trade reversal resulting from a change in market sentiment from bullish to bearish.


