Introduction
Trading is, without a doubt, one of the most alluring and exciting professions an individual could ever embark upon. It is also, arguably, one of the most dangerous. A career as a trader can be over in a heartbeat if the trader has not been properly educated to the market’s fickle ways. It is the potential of unlimited riches and income that seduce so many, yet the odds of success are heavily stacked against them. What is it that makes the difference? Why do so few succeed, where most others fail? The answer can be summed up in four words: discipline, education, hard work. It is the purpose of this article to equip you, the budding trader, with some of the education necessary to help you put the odds of succeeding in your favor. As for the discipline and hard work part, that is up to you. I would be willing to guess that success in trading is probably close to 10% knowledge and 90% discipline/hard work. Perhaps this is why the "mortality" rate of would-be-traders is so high. Not everyone is suited to short-term trading. Many brilliant people have been shot down in flames while trading. My theory is that they try to out think the market, out maneuver it. They also try to re-invent tried-and-true trade plans and end up making things more complicated than they need to be. Both are usually very bad ideas, which for the most part, end up failing, and worse, lightening your wallet, sometimes by quite a lot! I mention this only to make a point. That being true, the trading method you are about to learn about here in these pages, has been developed, traded, optimized and adapted in the real world of trading. This program is not some theoretical algorithm that some mathematician somewhere has dreamt up. No, this plan has earned its stripes the hard way. Through blood, sweat, and tears, through failures and success. It is the backbone of how I personally trade.
Getting Ready to Trade
It would probably be wise at this point to have a little discussion on a few important and key elements to our trade plan before we jump into the trading rules and setups themselves. These would be; our primary tool - the chart, which markets to trade and why, the individual - that being you, and lastly, funding and risk.
The Chart - Part 1
The chart that we tend to favor for this style of trading is what's known as a candlestick chart. Because of how it is physically constructed, it is very easy to read and interpret in the chaos of a trading frenzy. We'll take a closer look at it shortly.
Which Market
Now comes the important decision as to what, or, which of the many markets to trade. Not all markets are suitable to the average trader to trade, and not all are created equal. When it comes to short term trading, there are three market traits that the individual must pay very close attention to and look out for before he / she begins trading it.
They are as follows:
Liquidity - Any market under consideration for trading must be liquid. That meaning, look for markets that are highly active with many various participants and creating a large amount of trading volume. High volume on its own, does not guarantee liquidity, it is the volume spread out, or distributed over a vast number of traders, each with different agendas, that allows for the almost immediate execution of buy and sell orders.
Smoothness - What we as short term traders are looking for in a market is nice orderly movement of price. We stay clear of erratic, jumpy markets at all costs. Consistency, smoothness and "predictability" of price behavior are what you should be looking for. Markets with a history of wide gaps in prices, large and meaningless price swings, or otherwise just chop, with prices moving back and forth, going nowhere, should be avoided like the plaque!
Range - Lastly, the market must have enough room, or range to make trading it worthwhile. Look for markets that have at least a 750.00 dollar trading range top to bottom, on a consistent basis. With this size range, there should be adequate opportunities and potential to profit and cover the associated costs of trading.
You
As briefly touched upon during the introduction, many clever people are just not suited to trading. Each individual must make an honest evaluation of him / herself before putting hard earned money, and precious time on the line. It is just a fact that a lot of people just don't have the mindset or the emotional makeup for trading. For some, the ups and downs of trading swings are just too much to deal with. It is just a personality trait, simple as that. Also, a trader must be prepared for long, lonely hours sitting in front of, and staring at a computer screen. If you like or need to be in the presence of others while working, trading may not be for you. Take a good hard look at yourself, is trading really for me?
Funding and Risk
Like any other business, you need capital to start with. How much capital you have to work with will dictate what markets you can trade. The more volatile a market, the more risk you will need to assume to trade it. It is therefore imperative to be properly funded with a strict money/risk management plan in place. If you don’t, do not trade until you do!
The Chart - Part 2
Ok, let us delve a little deeper into the chart itself. The chart is simply a graphical and dynamic representation of the supply, demand and price characteristics of the market at any given point in time. It can also convey to us, the "mood" or the psychology of that particular market - again, at any given point in time or price level. Price, direction, and trend are what we need to know in order to place our orders intelligently and give us the highest probability to profit from a given trade. This is what the charts help us to do. The chart itself is made up of individual "candles" or price bars. Each of these candles show to us the price movement over the given candles duration.
For most of this essay, we will be using 15-minute candle stick charts, thus, each candle will represent 15 minutes of price action. Let us now look and see how the candle itself is constructed.
Example 1
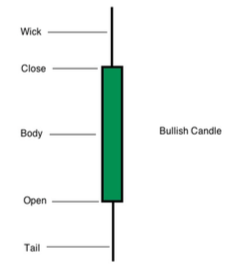
Let’s take a look at the Bullish Candle (below) first.
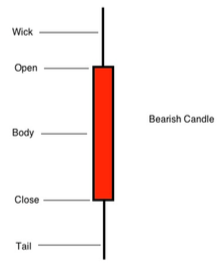
The candle is made up of 3 parts, the Body, the Wick, and the Tail. The distance between the top of the wick and the bottom of the tail is the entire range of price that occurred in the market during that 15-minute period. The bottom of the body was the price of the first trade made, and top of the body was the last trade made, for that 15-minute interval, hence the term open and close respectively. With a bullish candle, since prices closed higher than where they opened, then obviously, prices had to have been rising. Conversely, the Bearish Candle, “see below”, has its opening price higher than its closing price, therefore indicating prices fell during that period.
Depending on which charting software you use, bullish candles are usually either clear or green in color, while bearish candles will be filled, or red in color. In fact, nowadays, you can make the candles any color you wish.
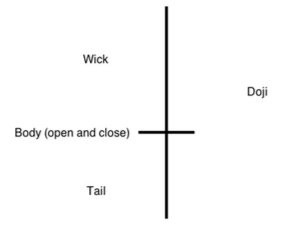
There is a third, and very rare candle that we look for, and that is the "Doji" candle. This candle opens and closes at the same price (or within a tick or 2 of each other). This is usually neutral as far as the market is concerned, prices are content where they are with one exception. If the Doji candle occurs as a “swing” high or a “swing” low point on the chart, they more often than not signal a market reversal is about to occur. Prices have a high probability of turning around and moving in the opposite direction. Keep your eyes peeled for them, especially in the vicinity of one of our Fire Lines!
Fire Lines
Fire Lines are our statistical proprietary indicator that we use to produce price levels or price points, where we expect to see a lot of significant intraday trading activity, as well as to determine the likely trend of the price action for that particular day. Fire Lines typically identify areas where prices will be supported in a down trend, or resisted in an uptrend. It is at these levels that we seek to trade at. It is here, that we can enter the market with the least amount of risk and the greatest amount of potential.
And now for a few definitions:
Inflection Point (I.P.): This is our strongest level and the point at which, if crossed, we expect the trend to change. As a rule of thumb, if prices are above the IP, the market is deemed to be bullish, if prices are below the IP, the market is considered bearish.
Upper Value Range (U.V.R.): The highest price level we would expect to see the market trade at on a given, non-trending day. Very bullish if prices are at or above this level - a great place to initiate a long position from.
Lower Value Range (L.V.R.): The lowest price level we would expect to see the market trade at on a given, non-trending day. Very bearish if prices are at or below this level - a great place to initiate a short position from.
Targets and Objectives: The prices or levels we would expect the market to reach should the current trend continue. At these levels we can look for a trade, however most of the time we are already in one by the time these areas are reached! As such, we just call them targets, or objectives. They can sometimes also provide re-entry points for those days that are trending strongly, or a place to add size to winning positions.
The “Abattoir”: A French word meaning slaughterhouse. I use it to describe the area between the moving average and a Fire Line. A trader, as a general rule, does not want to initiate a trade in this area as it is prone to giving false signals and whipsaw - like price action. Basically an area of consolidation where no tradable trend is present.
So those, in a nutshell are the Fire Lines.
Simple Moving Average (SMA): Essentially a trend following measurement. An arithmetic mean of the number of periods assigned to it. e.g. A 96 SMA on our chart will sum and average the price data of the last 96 candles and plot it on the chart as a line.
Now for the Meat of It - A Typical Day
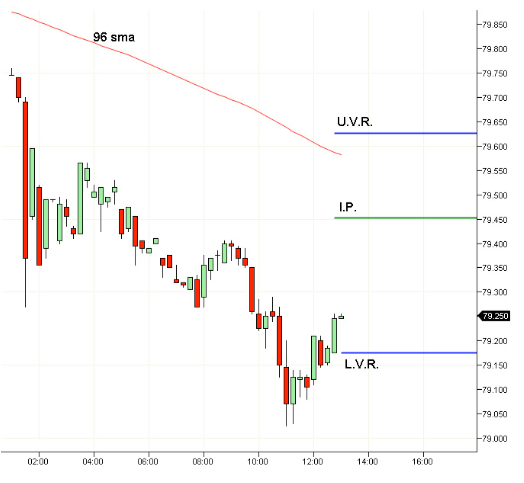
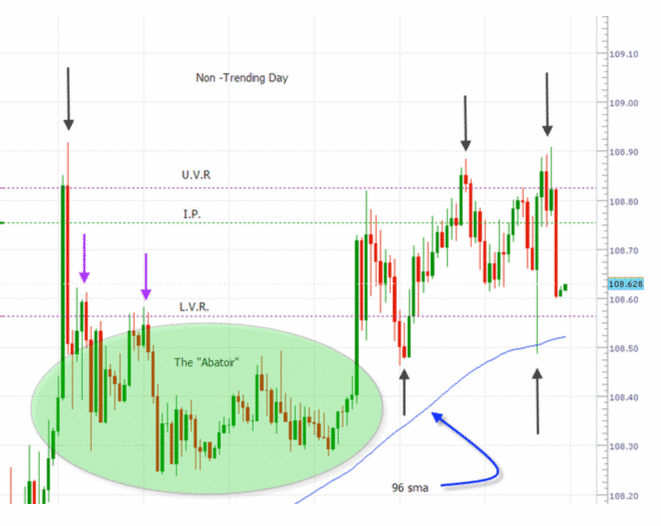
The first thing to do is to prepare your chart for the next trading session. I suggest just putting on the UVR, the IP, and the LVR lines only at first so your chart remains uncluttered and you can more clearly see what’s going on as prices begin to move. Of course, make sure your moving average is on the chart as well. The example below is pretty much how I have my chart set up going into the next trading session.
Non-Trending and Dangerous
Ok, let us examine the chart above and see what story it is trying to tell us.
Starting from the left hand side, notice how prices rapidly climb higher, go through the UVR (1st black arrow), and then just as quickly retreat. In fact, they fell back below the LVR where that level then became resistance (2 purple arrows). This is exactly the type of price action that gets so many new traders into trouble. When things get volatile, the adrenalin begins to flow and thoughts of fast and easy money fills their heads. For some strange reason, the thoughts of fast and easy losses never get thought about. Perhaps it is our optimistic nature as human beings, however optimism should NEVER be the basis of any one individual trade, be that getting into, or staying in a position. Optimism about ones trading, absolutely, but never when it comes to a trade! Risk management is what you need to focus on a day-to-day basis, and above average, unexplained volatility is usually a warning sign to stay away!
Now for the “Abattoir”
This is really not a big deal as it can be very easily recognized and avoided by following one very simple rule. DO NOT ENTER INTO A TRADE IF THE PRICE IS BETWEEN ANY OF THE FIRE LINES AND THE 96 SMA. Way more often than not, price will just bounce around between the levels, not a place where you want to be vulnerable and at risk. Sooner or later one side or the other will yield, and that’s when you want to play. Let the gamblers fight the battle, we’ll come in after the battle has been won on the side of the victors, and ride on their coat tails! Not glamourous or pretty, but usually highly profitable with little risk.
And Finally, the “Range”
This is the defined area between the Upper and Lower Value Range levels. (U.V.R and L.V.R.) Just like the “Abattoir”, this area can be subject to wild price gyrations and very erratic price movement. Typically, not a terrific spot to trade in. Having said that however, every once and awhile you can sometimes get a trade from the Inflection Point to either the U.V.R. or the L.V.R. depending on the trend, and of course depending on the stop size, or risk. But, as a general rule, trading within this range is dangerous and not recommended.
One last note on this chart. Notice both the U.V.R. and the L.V.R. get broken and then prices quickly return back inside the range (marked by black arrows). We don’t want to immediately initiate a trade when our levels are broken but instead wait to see if the broken level begins to act as support, as in the case of the U.V.R. breaking or becomes resistance, in the case of the L.V.R. being penetrated. We look for what we like to call, BHG (Break, Hold, and Go) before trading.
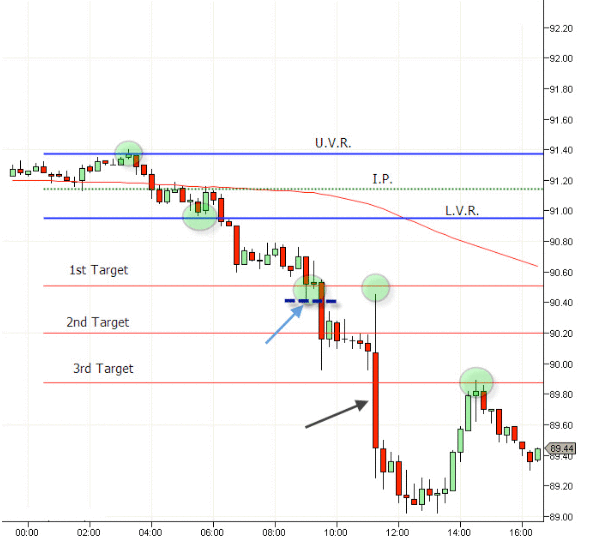
Here is an example of how I like to make a trade, in this case, a short in a strong down trend.
First thing to notice are the little green bubbles. See how at those points prices are coming to the Fire Lines and being repelled by them? The subsequent high and low swings now become perfect entry levels for us. As an example, we can see a swing low as marked by the light blue arrow. The following candle attempts to rally but is defeated... the selling pressure is still on. Therefore, we can quite safely place our sell order just below the marked swing low (broken blue line) with an initial objective of the 2nd Target. It is at these swing highs and lows (or very close to) at our Fire Lines that we seek to trade from.
Very often however, you just cannot get onto a trade safely. Notice the black arrow.
It is pointing towards a candle whose range is much larger than that of the other candles around it... a volatile situation likely caused by a news item or economic report. In this case the risks are just far too great relative to the potential rewards to try and trade it. The smart traders will likely retreat.
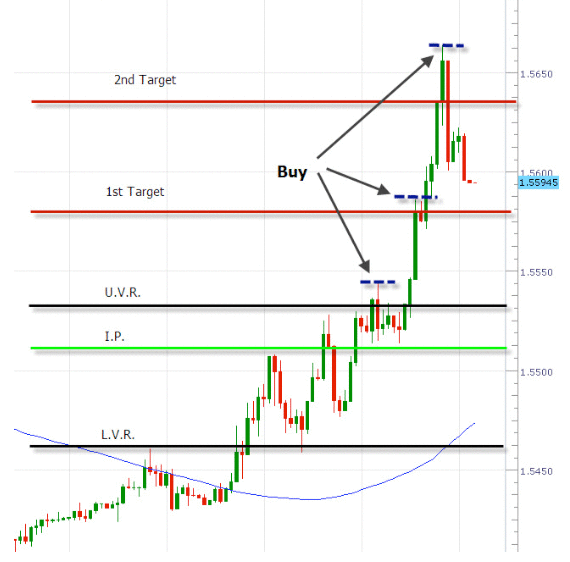
Let’s look at one more, this time on the buy side.
As you can see, it is pretty much the same idea as we had on the previous chart only this time we are buying at our Fire Lines in a strong uptrend. Line to line, smooth as silk.
In Conclusion
I hope I was able to shed a little light on the method I use for trading our Fire Lines.
The technique I described above is by no means the only one. Some use them to trade counter trend by placing limit orders on the actual levels, and wait for the market to come to them. Others use their own system of entry and use the Fire Lines for profit taking levels and stop placement, while others still use them solely for trend determination and enter and exit trades from their own proprietary signals. How you use them is entirely up to you.

