

The hours from the time London opens for business until New York closes are widely regarded as the best time to trade Forex, and with good reason. It is during these hours that the Forex markets usually experience the highest liquidity, i.e. the highest volume of trading. High volume usually correlates positively with a high amount of price movement, which gives the retail Forex trader a chance to make money through directional trading. This means going long or short of Forex currency pairs and hoping to exit with a profit.
It is possible to trade Forex profitably by using either technical or fundamental analysis, or a combination of both. A common mistake made by many Forex traders is overcomplicating technical analysis. For example, the simple fact that the price is higher than it was a few months ago is probably going to be more significant and reliable than the exact value calculated by some fancy complicated indicator.
If you are interested in using technical analysis to trade Forex and you like to start your trading at around 8am London time, there are some very simple methods you can use to forecast the probable direction and strength of two major currency pairs – EUR/USD and GBP/USD - just by taking a quick look at the Asian range.
Top Regulated Brokers
What is the “Asian Range”?
The “Asian Range” is not a concept that I invented. It is usually meant to refer to the high and low prices made by a currency pair from the time that Tokyo opens for business until London opens. Technically speaking, the Asian session runs a little beyond the time London opens as Tokyo stays open for an hour or so after that.
There are a few well-known trading strategies based upon a currency pair’s Asian range. The most well-known is probably trading the first breakout of the Asian Range, followed by using the highs and lows as key resistance and support, or trading reversals from fake breakouts. I am not convinced these strategies necessarily show reliable edges, but it can be shown that over recent years we can use the Asian Range to give a predictive edge as to what is probably going to happen between the London open and the New York close, just using a simple measure of how the price has changed during the Asian session, rather than looking at the highs and lows as is traditionally the case.
Asian Session Statistics
The methodology we can use is quite simple, and I can illustrate that by using the last five years of data regarding two currency pairs: EUR/USD and GBP/USD.
The concept is that at either 8am or 9am London time, we look to see how much the price has changed since midnight London time, which corresponds to the start of the Tokyo session which is the center of Asian Forex business. Very simply, if the price is up already, there is a higher probability that the price will end the New York session up even further, and vice versa if the price is down.
This seems very simple and too good to be true, but it is borne out by the statistics of the previous 5 years. It is not enough to say that the price must be up or down, we need a minimum filter for this move to be significant. It seems that the amount of 0.15% works quite well, and taking 9am London time works better than taking 8am London time as the end measuring point for the Asian price change.
Best Results
The best results for both pairs were achieved by taking the days where at 9am London time, the price had either risen since Midnight by more than 0.15% and less than 0.30% - in which case we can expect that New York will probably close higher – or fallen between the same amounts, in which case we can expect New York to close lower.
The statistics are as follows for these parameters:

What these statistics mean is that if at 9am London time the price has moved between 0.15% and 0.30% since Midnight, then about 57% of the time by the end of the day in New York it will have moved further in the same direction. The average move will be about 0.12%. This could be traded profitably simply by going long or short at 9am if the conditions or right, or it can be used as a model to tell you when to day trade currency pairs and in which direction.
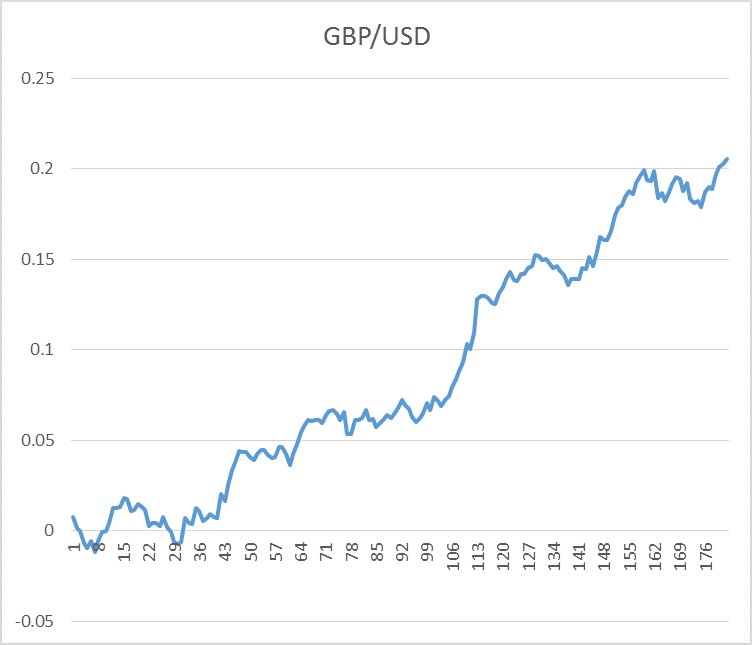
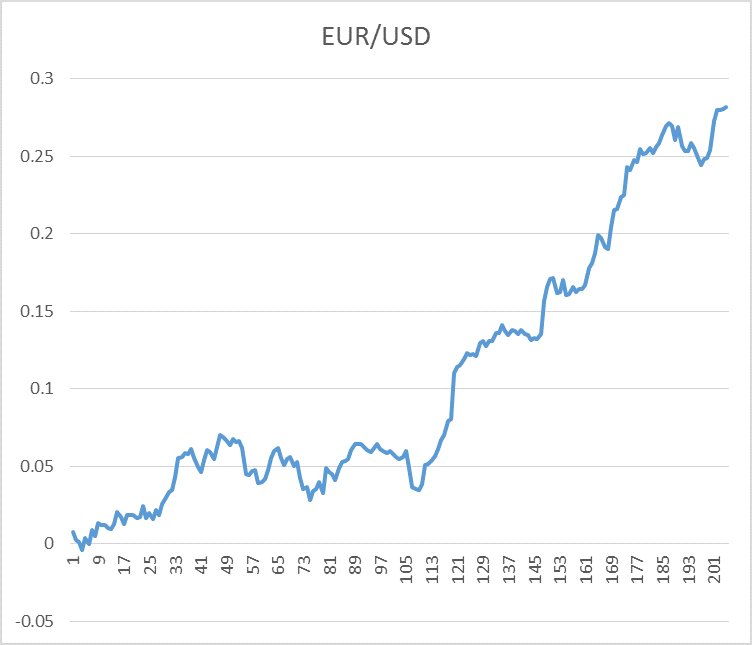
The equity curves for each pair shown below are sample and not time-based, i.e. a value is only shown where there is a trade. However it can be seen that both of the equity curves look fairly robust and healthy, especially the for the GBP/USD currency pair:
Strange but True
It is natural to think some extra conditions can be added to improve the results, for example only taking the signals that are in the same direction as the longer-term trend. In fact, adding this condition would not have improved the results significantly.
Something to watch out for: during periods of wild market volatility – such as were seen from 2007 to 2009 – the strategy does not perform well, so it best to forget about this strategy during such conditions.
Finally, do not try to trade this strategy with other Forex currency pairs: it does not work, not even with the USD/CHF which as a European currency pair, you would expect to behave similarly to EUR/USD and GBP/USD.