Although it may sound counter-intuitive, the typical use of Forex indicators can cause an inexperienced trader to lose money rather than make money. However, if you are going to use one, the best Forex indicator is the RSI (Relative Strength Indicator) because it reflects momentum, and it is well established that following Forex momentum can give you a winning edge. The RSI is a Forex momentum indicator and the best momentum indicator. If you will use the RSI, the best way to use it is to trade long when it is showing above 50 on all time frames or short if below 50 on all time frames. It is best to always trade with the trend of the last 10 weeks or so. Read on to learn more about how best to use the RSI indicator.
Top Regulated Brokers
What is the RSI (Relative Strength Index)?
Like many other technical analysis concepts, the Relative Strength Index formula was developed in the 1970s. The Relative Strength Index calculates the ratio of upward changes per unit of time to downward changes per unit over the look-back period. The actual indicator calculation is more complex than we need to worry about here. What is important to understand that if the look-back period, for example, is 10 units of time and every one of those 10 candles is closed up, the RSI will show a number very close to 100. If every one of those 10 candles closed below its opening price, the number will be very close to 0. If the action is completely balanced between ups and downs, the RSI indicator will show 50.
The Relative Strength indicator is defined as a momentum oscillator. It shows whether the bulls or bears win over the look-back period, which the user can adjust.
How do You Set Up and Adjust the RSI Indicator?
1. Choose and Open a Trading Platform: To use the RSI indicator, you'll need access to a trading platform or charting software.
2. Select Your Asset: Open a price chart for the asset you want to analyse.
3. Add the RSI Indicator: Look for an option to add indicators or studies to your chart; this should be very easy.
4. Set the RSI Parameters: Most RSI indicator software allows the user to make the following customisations:
- Period: The number of price bars or periods (e.g., days, hours, minutes) used to calculate the RSI. The default period is usually 14.
- Overbought and Oversold Levels: By default, the RSI uses 70 as the overbought threshold and 30 as the oversold threshold. These levels can be adjusted to fit your trading style and asset better.
- Calculation Method: The RSI is usually calculated with Wilder's Smoothing Method (Wilder's RSI). You may also be offered options for exponential or simple moving average-based calculations.
5. Apply and Customise: Once you've set the metrics to be as you want, apply the RSI indicator to your chart. Most software allows you to customise the appearance of the RSI line and its overbought/oversold levels as you wish.
How to Trade With the RSI Indicator
The RSI indicator is typically used in forecasting and trading strategies in the following ways:
- When the RSI is over 70, it should be expected to fall. A fall below 70 from above 70 confirms that the price is beginning to move down.
- When the RSI is under 30, it should be expected to rise. A rise above 30 from below 30 confirms that the price is beginning to move up.
- When the RSI crosses above 50 from below 50, it is taken as a signal that the price is beginning a move up.
- When the RSI crosses below 50 from above 50, it is taken as a signal that the price is beginning a move down.
What is the Best Way to Use the RSI?
The third and fourth methods described above regarding the cross of the 50 levels are generally superior to the first and second methods concerning 30 and 70. That is because better long-term profits can be made in Forex by following trends than by expecting prices to always bounce back to where they were: be careful not to move stop losses to break even too quickly.
This is a point worth expanding – whether to follow trends or "fade" them by trading against them. There is a lot of old-fashioned trading advice, most developed in the pre-1971 era when currency exchange rates were not floating but fixed by pegs to gold or other currencies. In this era, trading was conducted mostly in stocks or, to a lesser extent, in commodities. It is a fact that stocks and commodities tend to show a markedly different price behaviour from the exchange rates of Forex currency pairs – stocks and commodities trend more often, are more volatile, and have longer and stronger trends than Forex currency pairs, which have a stronger tendency to revert to a mean. This means that when trading Forex, most of the time, using the RSI to trade against directional moves by using the methods 1. and 2. described above will work more often but will make less profit overall than using methods 3. and 4. to follow trends by trading in the direction of the prevailing strong trend, when such a trend exists. Although trying to win smaller amounts more often and using money management to compound winnings quickly might seem attractive, it is much harder to build a profitable mean reversion model than a good trend-following model, even when trading Forex currency pairs.
The best way to trade crosses of the 50 level is by using the indicator on multiple time frames of the same currency pair.
Multiple Time Frame Cross of the 50 Level
Open multiple charts of the same currency pair on several time frames: weekly, daily, H4, and down. Open the RSI indicator on all the charts and make sure the 50 level is marked. Practically all charting programs or software include the RSI, so it should be easy. A good look-back period to use in this indicator is 10. It is also important that the look-back period is the same on all the different time frame charts.
If you can find a currency pair where all the higher time frames are either above or below 50, and the lower time frame is the other side of 50, then you can wait for the lower time frame to cross back over the 50 and open a trade in the direction of the long-term trend.
The higher or lower the RSI value is, the better the trade is likely to be. It is an iron law of the markets that strong trends are more likely than not to keep going and that a retracement that turns back around tends to move nicely in the direction of the trend. This method is an intelligent way to use an indicator: it identifies retracements within strong trends and tells you when the retracement will likely end.
Short Trade Example
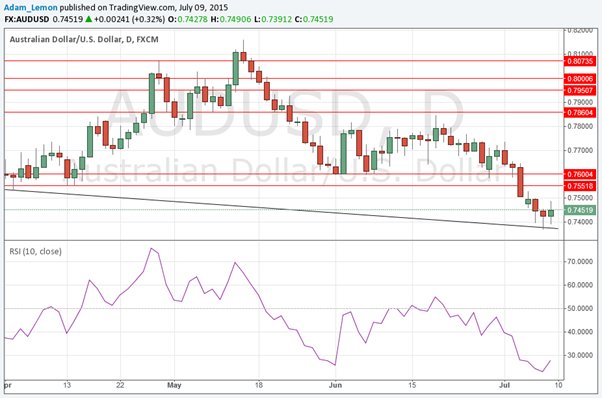
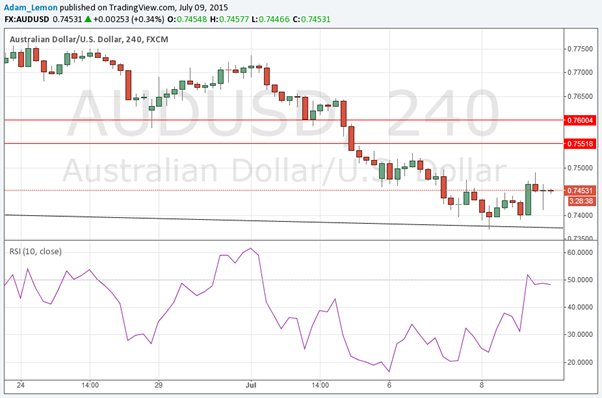
An example is shown below using the AUD/USD currency pair in several time frames, with the RSI indicator set to a look-back period of 10. It is below 50 on the weekly, daily, and 4-hour time frames and is just crossing from above 50 to below 50 on the 5-minute time frame. This could be interpreted as a signal for a short trade.
This can be combined with other strategies such as support and resistance, moving average crossovers, time of day, etc.
It can also be a day trading strategy when you are prepared to drop down to low enough time frames.
Weekly:
Daily:
4 Hours:
5 Minutes:
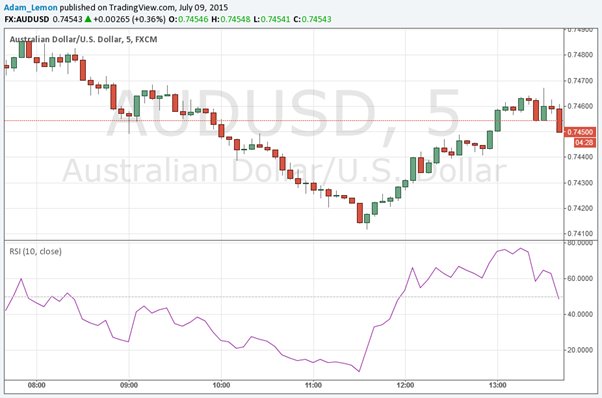
Note: this is not a perfect example, as it would have been better if the hourly time frame also showed the RSI below 50. The best results are obtained when no big gap exists between the used time frames.
Three New Ways to Use RSI in Forex
The first is what Wilder called a failure swing. This happens when RSI exceeds a previous extreme (overbought above 70 or oversold below 20), corrects, and heads for that extreme but fails to achieve it. You would place a trade on the close of the candle that corresponds to the second peak or dip.
Here's an example from the hourly EUR/JPY chart. Price and RSI are rising in tandem. RSI becomes overbought, above 70. Both correct. They again grow, but the second peak of RSI is lower than the first. You'd sell on the close of the candle that accompanied the lower peak.
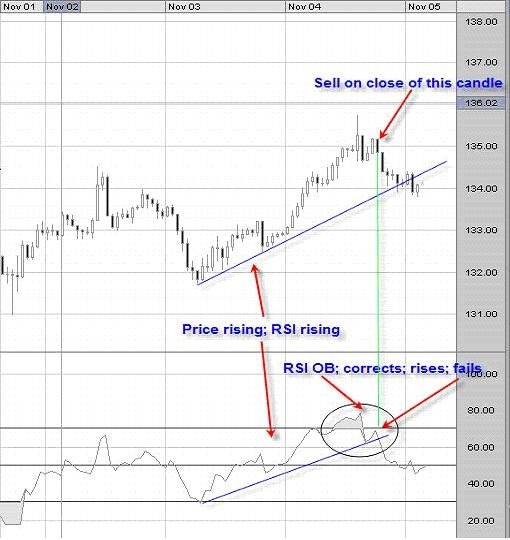
If the price and RSI were falling, the situation would be reversed. You'd buy on the candle close when the indicator becomes oversold below 30, corrects, and fails to reach the prior low. Confirming the trade with other evidence—such as support, resistance, or candlesticks—is advisable.
A second use of RSI involves support and resistance, not with price, but on the indicator itself. It can help you gauge if a trend is changing.
Here, you would watch the indicator to ascertain that it never rises above (in a downtrend) or falls below (in an uptrend) key levels. Studying past RSI behaviour helps you find these levels.
The 15-minute chart of GBP/USD provides an example. Price and RSI are rising. Price then becomes congested, and RSI starts to drop. Is this a simple correction, or is the trend changing? Examining RSI provides a clue. RSI never drops below 43. This is above the last dip in RSI and far above an oversold reading of 30. On the second dip in price, with the RSI holding above 43, the trader can feel confident this is a correction and buy on the candle close of the second dip. A safer trade would involve waiting until the price breaks and closes above the congestion top. As always, finding other evidence to support the trade decision is best, such as price support and resistance levels, candlesticks, or a comparison with other indicators.
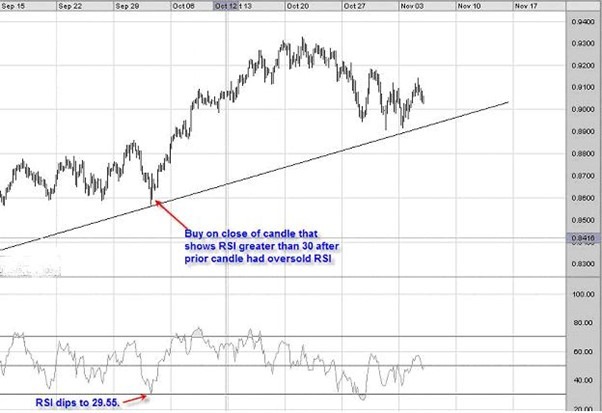
A third way to use RSI is when both price and indicator are in an overall trend in a larger time frame, for example, daily. You then watch the 3-hour or 1-hour chart to find an overbought or oversold reading in RSI accompanying a price rally or reaction. You will place a trade when the RSI overbought or oversold condition corrects.
Here's an example with the AUD/USD three-hour chart. Its uptrend began in March 2009. Where's a good entry point if you want to go long? In the chart below, you see a price correction to .8569. RSI drops to 29.55, oversold. On the next candle close of .8655, the RSI is 40.56. This is the buy signal. Had you bought, you would have made hundreds of pips as prices climbed to .9328 in late October.
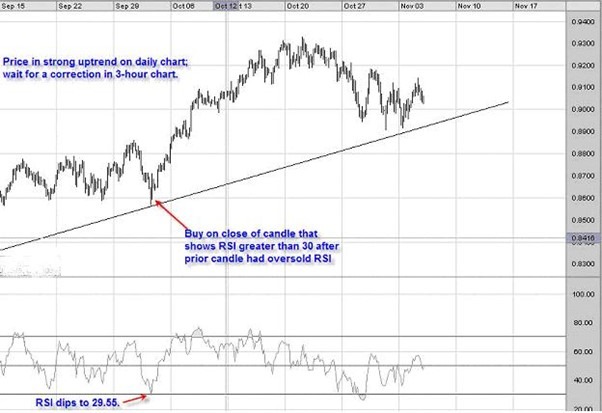
The key to this technique is finding a strong trend on a larger time frame and then trading corrections on a smaller one. The best results seem to be when you use daily and one –or three-hour charts. As always, look for other evidence to support your decision—staying above a trend line or candle behaviour.
Using RSI with Additional Indicators
Using the Relative Strength Index (RSI) and other technical indicators can ensure a better overall analysis. Here are some ideas for using RSI in combination with other indicators:
- Moving Averages: Using RSI with moving averages can help confirm trends and spot potential reversals.
- RSI and Moving Average Crossovers: Look for instances where the RSI crosses 50 simultaneously as a fast-moving average crosses a slower one in the same direction. This can verify a trend reversal.
- RSI and Moving Average Convergence Divergence (MACD): When the RSI crosses above the signal line while the MACD histogram turns positive, it can indicate a bullish signal, and vice versa.
- Support and Resistance Levels: If the RSI is indicating a reversal at the same time as the price is reversing off a key support or resistance level, that can be a great signal:
- RSI and Fibonacci Retracement Levels: Look for confluence between RSI levels and key Fibonacci retracement levels.
- RSI and Pivot Points
- Stochastic Oscillator:
- RSI and Stochastic Oscillator Divergence: When both RSI and the Stochastic Oscillator show divergence from price action, this suggests a strong divergence signal for a reversal.
- Bollinger Bands:
- RSI and Bollinger Bands: If the price has crossed above the upper Bollinger Band or below the lower one and begins to reverse back into the bands, this can be a strong signal if RSI also indicates a reversal.
- Multiple Time Frames: Analysing the same asset on the same RSI settings in multiple time frames can be a great way to use this indicator and may provide powerful trend-following signals.
How is RSI Used in Day Trading?
Day trading is very challenging because of its short time horizon. The first thing any day trader should do is be aware of what the price has been doing over the long term instead of just focusing on the day's price action. Therefore, the first step for using RSI in day trading should be to look at what the RSI says about the past several weeks to determine whether or not the price is in a long-term trend or whether the price is just going sideways.
If the price is in a long-term trend, the RSI is best used on a lower time frame to identify when the price has completed a retracement against the trend and has started moving in the direction of the trend again to find an entry signal.
An example could be that the 10-period RSI on the weekly chart shows a value above 50, indicating a bullish trend. The trader then drops down to the 10-period RSI on the 15-minute chart to find a dip below 50, followed by a bullish reversal, producing a rise above 50. A bullish candlestick with the RSI crossing 50 simultaneously could be a great entry signal for a long day trade.
If the longer-term RSI shows consolidative price action, a better approach is going short once the short-term RSI crosses above 70 and then crosses below it or long once the short-term RSI crosses below 30 and then crosses above it.
RSI vs MACD
Both the RSI and the Moving Average Convergence Divergence (MACD) indicators are momentum indicators. This means they give similar readings, although not identical, as the MACD is a little more stable and slower to react to price changes than the RSI. Many traders believe that when both indicators give the same signal simultaneously, it is an especially powerful signal, so these traders like to use RSI with the MACD simultaneously.
The MACD indicator measures the difference between two moving averages. The most popular signal generated by the MACD is a crossover of the two moving averages. This often happens simultaneously as an RSI on similar settings, showing a cross of the 50 level. Another thing to look for can be the RSI crossing back below 70 while the MACD dips from within to underneath the overbought zone or crossing back above 30 while the MACD rises from within the oversold zone to cross above it.
RSI Pros & Cons
Pros of the RSI
- Generates Overbought and Oversold Signals: RSI helps identify potential overbought and oversold conditions, which can be used to predict price reversals.
- Generates Divergence Patterns: RSI divergence can be a powerful signal for potential trend reversals.
- Objective and Simple: the RSI is a straightforward, easy-to-read indicator.
- Versatility: RSI can be used within different time frames, assets, and trading strategies.
Cons of the RSI
- False Signals: the RSI is not a magic bullet, and if used carelessly in unsuitable market conditions, it will generate many false signals.
- Lagging Indicator: RSI is a lagging indicator that reacts to past price data.
- Not Suitable for All Markets: RSI works better in trending markets than in ranging ones.
- Parameter Sensitivity: The RSI usually produces better results when considering its long-term reading over several weeks or months. It is often too sensitive on lower time frames to produce accurate signals.
Bottom Line
The RSI indicator is a momentum indicator, well-respected by traders as one of the few indicators that can be used under certain conditions to provide a winning trading edge for traders willing to trade in the direction of strong momentum. It simply calculates the ratio of historical upwards to downwards price movement, giving a snapshot of momentum conditions.
The RSI is best used to determine trends on a higher time frame in relation to its 50 level, and then to find pinpoint entries on shorter time frames by using retracements beyond the 50 followed by crosses back over it in the direction of the trend.
In long-term ranging conditions in the Forex market, trading bullish reversals below 30 and bearish reversals above 70 is usually the best way to use this indicator.
FAQs
What is the best way to use the RSI indicator?
The best way to use the RSI indicator is simultaneously using it on multiple time frames. When the RSI shows a multi-week or monthly trend, use the RSI on a lower time frame and look only for signals in the direction of the longer-term trend. A cross above or below 50 is the best trend signal.
What is the RSI 30 70 strategy?
The RSI 30 70 strategy is a mean reversion trading strategy based on the assumption that when a market is overbought, it is likely to decline, and when a market is oversold, it is likely to rise. In this strategy, a long trade entry signal is generated when the RSI dips below 30 and then crosses back above it; when the RSI pops above 70 and then crosses below it, a short trade entry signal is generated.
What is the 5-star RSI strategy?
The 5-star RSI strategy states that when the RSI is above 60 on longer time frames, it should not fall below 40 on shorter time frames, so a bounce at the 40 areas on such a short time frame is a long trade entry signal. Conversely, when the RSI is below 40 on longer time frames, it should not rise above 60 on shorter time frames, so a bounce off 60 on a short time frame is a long trade entry signal.
What is the RSI 50 50 strategy?
The RSI 50 50 strategy is a well-known trend-following strategy that says when the RSI is above 50, traders should look for long trade entries in line with the bullish trend, and when the RSI is below 50, traders should look for short trade entries in line with the bearish trend. It works best when the RSI measures many weeks or even a few months.
What is the 2 RSI strategy?
The 2 RSI strategy was developed by Larry Connors, which holds traders should buy an asset when the 2-period RSI shows a reading below 10 and sell an asset when the same shows a reading above 90. The strategy is designed to produce short-term gains from the reversion to the mean, which often follows a sudden and extremely strong price movement, i.e. a spike.
What is the best combination with the RSI indicator?
I believe the best indicator to use with the RSI is to identify reversals from key support or resistance levels when the RSI also shows a cross back above 30 or back below 70.
Should you buy when the RSI is below 30?
Buying when the RSI is below 30 could be a good idea if the price has begun to rise firmly, especially if it crosses back above 30, as part of a mean-reversion or “buy the dips” trend-following strategy.
Which RSI range is best?
In Forex, when the RSI crosses 50 on a long-term reading, it can be a great trade entry signal. On shorter-term time frames or in ranging conditions, buying when the RSI crosses back above 30 or below 70 is usually best.
