

This article examines several characteristics of the Outside Bar Trading Strategy used during an outside bar momentum break. These qualities include the conditions needed for a potential entry consisting of a single price bar/candle, where to place a stop loss and how to aim for a profit target using a risk to reward ratio benchmark of 1:1.
A breakdown of the results of back testing for EUR/USD, GBP/USD and USD/JPY during three different time frames--daily, 4 hour, and 1 hour--is also discussed in detail.
Details of another outside bar trading strategy in the Momentum Trading Strategy series can be found at Pin Bar Momentum Strategy.
STRATEGY #1 – OUTSIDE BAR MOMENTUM BREAK
Entry
A potential entry used with the Outside Bar trading strategy is identified from one single price bar/candle. The candle just needs to meet two conditions when it closes:
1. It must be an Outside Bar – this is a bar with a high at least 1 pip above the high of the previous bar, and a low at least 1 pip below the low of the previous bar.
2. It must close in the top or bottom quarter of its range – the range is calculated by subtracting the bar’s high from its low.
If the bar closes in the upper quarter of its range, we are looking for its high to be exceeded by at least one pip by the very next bar, and at this price we enter long. However if the price trades below the low of the Outside Bar before this happens, the entry is not taken.
If the bar closes in the lower quarter of its range, we are looking for its low to be exceeded by at least one pip by the very next bar, and at this price we enter short. However if the price trades above the high of the Outside Bar before this happens, the entry is not taken.
Stop Loss
The stop loss is simply placed one pip beyond the other side of the candle. If the trade is long, it is placed one pip below the low of the candle. If the trade is short, it is placed one pip above the high of the candle.
Examples of entries and stop loss placements when using the Outside Bar trading strategy are shown below:
Long Entry
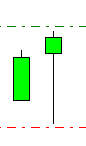
Note that the close is in the top quarter of the candle.
The long entry order is shown by the dotted green line, 1 pip above the high of the candle that has just closed.
The stop loss is shown by the dotted red line, 1 pip below the low of the candle that has just closed.
The order must now be triggered by the next candle, before the red line is hit.
Short Entry
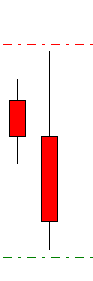
Note that the close is in the bottom quarter of the candle.
The short entry order is shown by the dotted green line, 1 pip below the low of the candle that has just closed.
The stop loss is shown by the dotted red line, 1 pip above the high of the candle that has just closed.
The order must now be triggered by the next candle, before the red line is hit.
Profit Targets
A detailed discussion of profit targets and trade management is beyond the scope of this e-book. The intention here is not to rely on the market’s tendency to produce an abnormally large number of “outliers” to build a profitable strategy, but to test the robustness of simple strategies by aiming for a reward to risk ratio of 1:1, and using that as a benchmark.
Therefore, the profit target on each trade is simply the same as the risk. For example if there are 50 pips between entry and stop loss, the profit target is also 50 pips from the entry price.
Competitive spreads were factored in to the back test, so do not be afraid to aim for the spread as profit too, provided you have a decent broker and reasonable spread at entry.
Issues
There are three common worries that crop up when trading with the Outside Bar strategy. We list them below and suggest how best to deal with them:
1. If a trade is left open overnight, most brokers will charge a little interest. This is not factored into the back test results, and will slightly reduce - but should not significantly detract from - the overall profitability.
2. Often a bar will close very near the entry price, preventing a pending order being entered due to the broker’s minimum distance requirements, especially on lower time frames. The only solution is to wait with your finger on the trigger for a manual entry, hoping the price retraces enough to allow the submission of a pending order. This requires alertness and a nimble trigger finger!
3. Don’t forget to cancel any trade entries that are not triggered by the very next bar, or when the bar exceeds the other end of the Outside Bar.
Strategy Justification
When employing the Outside Bar strategy, an Outside Bar may indicate either a reversal, or a failed attempt at reversal that ended with a reversal in the opposite direction. It is therefore an indication of momentum and impulsiveness, and possibly identifies that an S/R level or zone has been reached from which the price has been rejected.
The close of the Outside Bar in either the top or bottom quartile and the breaking of that quartile during the next bar before the other side is broken, are further indications of strong momentum in the direction of the trade.
OUTSIDE BAR MOMENTUM BREAK: BACK TEST RESULTS
The testing was conducted on three time frames: daily, 4 hour, and 1 hour. The daily candles that were used opened and closed at Midnight GMT. The 4 hour candles used are also on GMT time. The 1 hour candles used are set to London time for greatest accuracy regarding time-of-day fluctuations. Note that during half of each year, London time and GMT differ by 1 hour.
Daily Time Frame
The historical data used ran from 1st January 2001 to 30th October 2013.
The hypothetical results were as follows:
These results are a little disappointing. Only USD/JPY produces a positive expectancy per trade greater than 50%, although EUR/USD is also slightly profitable. The GBP/USD result is not good and when all the pairs are totaled, the result seems more or less random, suggesting this candlestick pattern is not significant.
However, by applying a simple filter, we can reduce the number of trades but significantly improve the hypothetical results.
The filter is simply to only use as signals those Outside Bars that are larger than any of the previous 5 days, i.e. that have a greater range in pips than any of the previous 5 daily candles. Let’s see how the hypothetical results look after applying this filter:
A few points of note:
• The filter improves the hypothetical results for all of the pairs, significantly in the case of EUR/USD and GBP/USD, but only very marginally in the case of USD/JPY.
• Taken together, there are 239 trades in the sample, which is large enough over a 12 year period to have some statistical validity.
• The Outside Bar strategy cannot be made profitable with GBP/USD on this time frame.
• The EUR/USD hypothetical results are significantly improved by applying the filter.
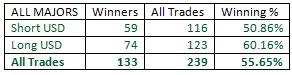
Therefore it is possible to consider using this strategy on the daily timeframe without the filter on USD/JPY, and with the filter on EUR/USD. Doing this from 1st January 2001 to 31st October 2013 would have produced the following hypothetical results:

This would have produced a positive expectancy of 17.04% per trade.
An average of about 17 trades was triggered each year, slightly more than 1 per month.
I find these results plausible as the filter helps to identify relative impulsiveness of new moves which tend to be reversals. The fact that the filter has a greater impact on more liquid pairs also makes sense.
H4 Time Frame
The historical data used ran from 1st November 2003 to 31st October 2013.
Everyone can trade the daily time frame, as long as they can be awake at Midnight GMT. We have also run tests on shorter time frames for the interest of more active traders.
The hypothetical results were as follows:
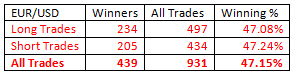
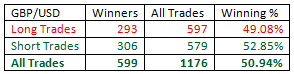
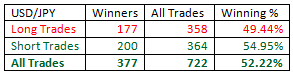
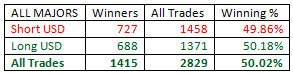
The hypothetical results seem to be disappointing. We have a very large sample of almost 3,000 trades overall and the winning percentage is only very marginally better than random. Let’s see if things can be improved by applying the filter of “larger than the previous 5 candles”:
Just as in our daily time frame back test, the filter improves the hypothetical results of each of the pairs, with the exception of USD/JPY. However the edge we are left with is only a little over 5% on our sample of almost 1,000 trades. Getting such a result over a large sample is statistically significant.
The problem is that only GBP/USD has enough of an edge as it is. We need to investigate further to see if another logical and simple filter can sharpen the edge: time of day.
Time of day is important in the Forex market, as the volatility and momentum properties of different currencies tend to fluctuate at different times, following the rhythms of national business hours. Let’s drill down into the results by time, pair by pair.
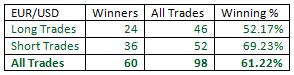
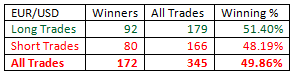
EUR/USD
The best hypothetical results are achieved by trading only the candle that closes at Noon GMT (55.68% winning trades from a total of 88 trades). The candle closing at 4pm GMT also produces a positive edge (53.72% winning trades of a total of 121 trades). Taking the two candles together gives a winning ratio of 54.55% out of a total of 209 trades.
Unfortunately, there is too much variance between the long USD and short USD trades. The long USD trades win at Noon but loses at 4pm, and the situation is reversed at 4pm. Due to this interesting quirk, the trade is best avoided, as further research beyond the scope of this book is needed to determine whether this is more likely to be the effect of trend or money flow.
The candle closing at Midnight also has a winning edge, but is so rare and has such a small sample that it should be disregarded.
Therefore it is probably best to forget about trading the Outside Bar strategy on EUR/USD on the H4 time frame. We will talk about the reasons why EUR/USD can be a problematic pair to trade on shorter time frames later when we discuss the 1 hour time frame.
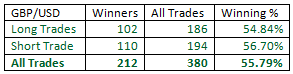
GBP/USD
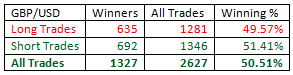
Our starting win rate of 55.79% seems pretty respectable over 380 trades. However it can be improved by adding time of day as a further filter as follows:
• Trading the “larger than previous 5” candles closing at 4am GMT. Small sample, but a winning rate of 76.47%. Sample size of 17 trades.
• Trading the “larger than previous 5” candles closing at 8am GMT. Small sample, but a winning rate of 61.54%. Sample size of 52 trades.
• Trading all candles closing at 4pm GMT. A sample size of 163 trades and a winning rate of 56.44%. The hypothetical results for short USD trades are considerably better than for long USD trades.
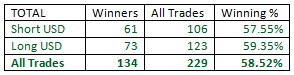
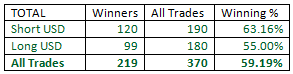
Taken together, the recommended trades have produced the following hypothetical results over the previous 10 years:
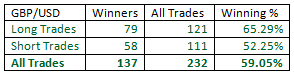
This gives a considerably better win rate than just taking all the “bigger than previous 5” candles, but does reduce the total number of trades by about one third. Overall expectancy is a little less but drawdown is reduced.
This would have produced a positive expectancy of 18.10% per trade.
An average of about 23 trades was triggered each year, slightly more than 2 per month.
I find these results plausible, as a large candle during the low-liquidity Asian session indicates a strong market sentiment and the candle closing at 4pm GMT includes most of the high-volume London / New York overlap.
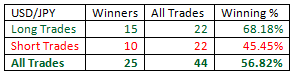
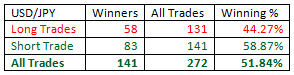
USD/JPY
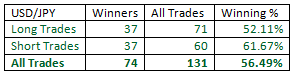
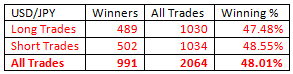
Our starting win rate of 51.84% can be improved by adding a time of day filter and adding or removing the “bigger than previous 5” filter as follows:
• Trading all candles closing at 4am GMT that are smaller than the largest of the previous 5 candles. This produced a win rate of 60.39% after a total of 154 trades.
• Trading all candles closing at 8am GMT that are larger than any one of the previous 5 candles. This produced a win rate of 65.00% after a total 20 trades.
Taken together, these trades have produced the following hypothetical results over the previous 10 years:
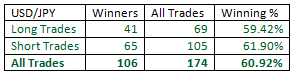
This would have produced a positive expectancy of 21.84% per trade.
An average of about 17 trades was triggered each year, about 1.5 per month.
I find only the 8am GMT result significant for reasons of momentum and impulsiveness.
Taking all the highlighted trades on the H4 timeframe in total, this would have produced a positive hypothetical expectancy of 19.70% per trade.
An average of about 40 trades was triggered per year, about 3.4 per month.
Time Frame
The historical data used ran from 1st November 2003 to 31st October 2013.
We also ran tests on the 1 hour time frame for the most active traders.
The hypothetical results were as follows:
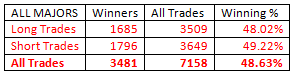
Again, the hypothetical results seem to be disappointing. We have a very large sample of over 7,000 trades overall and the result is more or less random.
Applying the filter of “larger than the previous 5 candles” does not change the hypothetical results significantly.
Let’s try a new and very simple trend filter that can sensibly be applied to a short timeframe such as 1 hour. There is a lot of complex discussion about how to identify and measure trends, but we can keep it very simple:
1. Is the price higher or lower than it was 24 hours ago?
2. Did the price just make the high or low of the last 24 hours?
Let’s look at the pairs individually, also applying time of day filters where appropriate.
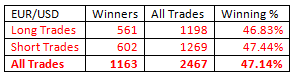
EUR/USD
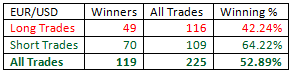
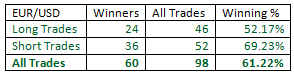
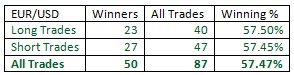
The only meaningful advantage that can be extracted here is trading those candles that make a higher high (for longs) or lower low (for shorts) than the candle 24 hours previously, between the hours of 11am and 1pm London time. This trade is quite rare and consists of a sample of only 87 trades, but it has produced winners 57.47% of the time. Despite the small sample size, this finding can be seen as significant, as this pair almost always makes a new high or low during the New York session, and in these cases has been demonstrating momentum over a 24 hour period. Therefore I see this as a plausible result.
The hypothetical results were as follows:
Trades taken earlier than this have produced adequate hypothetical results over large samples, but the winners are skewed very disproportionately towards long USD trades.
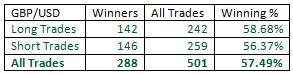
GBP/USD
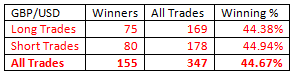
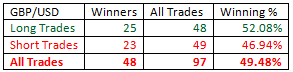
The most effective filter with this pair and time frame is time of day. The following times of day have historically proven to be hypothetically profitable for entry over the previous decade:
• Between 2am and 3am London time. There have been 139 trades with a winning percentage of 56.83%. Unfortunately this period of time does not correspond with anything significant so I cannot see this as a meaningful result.
• Between 11am and 2pm London time. This includes the peak trading volume period of the early London/New York overlap and the time by which the London session has often begun to establish a direction for the session. So I see this as a meaningful result. There have been 253 trades with a winning percentage of 57.31%.
• Between 3pm and 4pm London time. There have been 109 trades with a winning percentage of 58.72%. This time period does correspond with part of the high-liquidity London / New York session overlap, but there is no reason why this narrow segment of a single hour should produce more high probability trades than the remainder of the 4 hour overlap. Therefore I do not see this as a meaningful result.
Overall, trading at these times of day, the hypothetical results were as follows:
Additionally, any signal bar at any time that is larger than any of the previous 100 bars has shown a 56.73% probability of a winning outcome, out of a total 104 trades. As very few of these have occurred at the times of day outlined above, this can add another 94 trades which have shown a historical hypothetical winning ratio of about 57.44%. I see this result as meaningful as the relative size of the bar to previous bars indicates momentum and impulsiveness.
USD/JPY
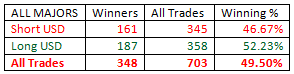
The most effective filtering that can be produced with this pair, by far, is combining the use of two filters:
• Whether the Outside Bar is making a new 24 hour high or low.
• Time of day: restricting trades to the Tokyo session.
This combination produced the following hypothetical results:
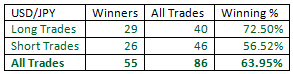
I do not see this as a meaningful result as there is no reason why new highs or lows should be made during the Tokyo session.
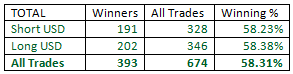
Taking all the highlighted trades on the H1 timeframe in total, this would have produced a positive hypothetical expectancy of 16.62% per trade.
An average of about 67 trades was triggered per year, about 5.6 per month.
TIME MAP OF HISTORICALLY PROFITABLE TRADES USING STRATEGIES #1 / #2*
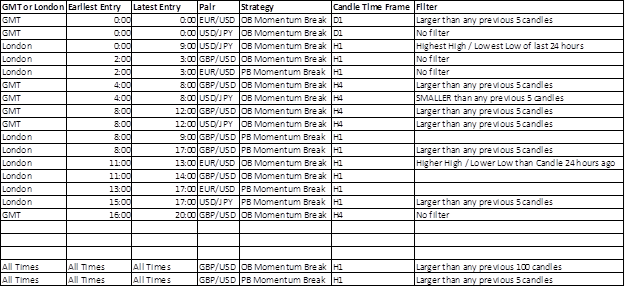
* Strategy #2 refers to the 2nd article in the Momentum Trading Strategies seriese that tests the Pin Bar Trading Strategy. Click here to read it.
Overall, the results show that volatility and time of day are important factors in determining market movement predictability after candlestick patterns.