

What is a Japanese Candlestick?
Japanese candlesticks are just a way of graphically representing fluctuations in price over time. In western countries, traders used bar charts in the same way, but the Japanese candlestick became popular worldwide in the 1990s as most traders found the format more informative than the old-fashioned bar.
Just like a bar in a price chart, each Japanese candlestick represents price fluctuation over a historical point in time, depending upon the time frame of the price chart it appears on. For example, in a daily price chart, each candlestick represents one day. Each candlestick is drawn using its open, high, low, and closing prices. The area between the open and close is filled out horizontally with solid color and called the “real body”. When the close is higher than the open, the candlestick is colored a bullish color (usually green or blue). When the close is lower than the open, the candlestick is colored a bearish color (usually red). If the price moved higher than the higher of the close or the open during the period when the candlestick was forming, a vertical line extends upward from the real body of the candlestick to reach the highest point at which the price traded. If the price moved lower than the lower of the close or the open during the period when the candlestick was forming, a vertical line extends downward from the bottom of the real body to reach the lowest point at which the price traded.
Most technical analysts today find Japanese candlestick charts easier to read than bar charts, and more expressive of the story behind how the price movements were made.
With enough practice, you will be able to see the story told by the movement of the past ten or twenty candlesticks, and this will make your analysis of the most recent one, two, or three candlesticks more powerful, because looking at the longer-term history will give you the context of what is happening now, which can be very helpful in judging whether the moment is right to enter a trade long or short.
How to Read Candlestick Patterns in Forex
Once you have learned several important candlestick patterns, you will feel eager to try them out in your Forex trading. However, it is important to be careful, because it is easy to try too hard to spot them and start finding them everywhere, which can lead to overtrading. The best thing to do is to scroll back through historical Forex price charts and look at the candlestick patterns which really jump out at your eyes. Could they have produced a successful trade for you? When you look at the successful candlestick setups, do they have anything in common? You will likely find that the best candlestick patterns were relatively large and very clear and easy to read. Another thing which is very important is to understand that candlestick patterns which happen at key support and resistance levels, or at extreme highs and lows, are much more likely to produce good trades than patterns which form in the middle of nowhere in particular.
The Forex candlestick patterns explained below are all Forex reversal candlestick patterns which can indicate where the price is likely to make an important turn. If you can successfully identify these likely reversals, you have entry points for opening trades with a probability of giving a good, profitable reward to risk ratio. These candlestick patterns can also be used as continuation signals when they fail to produce a reversal, and the price begins moving beyond their price action in the direction of the longer-term trend.
Now let’s look at the most important Japanese candlestick patterns in Forex. Learn these, and you will be well on your way to understanding price action.
Hammer/Shooting Star
Like many candlesticks, this pattern has a bullish and bearish version. The bullish one is called the hammer as it looks like one. The bearish one is called the shooting star. The hammer features a long wick to the downside but opens and closes at roughly the same level. The opening will bring initial selling, but in the end the buyers come back and push prices much higher and to the virtually unchanged level. This suggests that the sellers have failed to keep prices down, and that exhaustion may be setting in for the sellers. These are most important when at the end of a downtrend and can often signal a trend change.
Hammer candlesticks are also known as pin bars.
Inverted Hammer
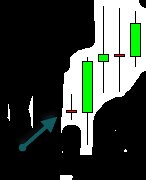
The shooting star (or inverted hammer) is the exact opposite of the hammer. The inverted hammer, as you would expect, is the inverse of the hammer candlestick. Simply put, it is an “upside down hammer.” This will form on either a pullback or towards the bottom of a downtrend, and suggests that the buyers came into the market, but could not hang on to the gains. However, it is a very strong sign when the market turns around and takes out the top of that wick. It shows that the buyers not only attempted during one candlestick to go higher but came back and pushed even harder to overcome that short-term resistance.
Notice that in the price chart below, the “inverted hammer” formed after a very bearish candlestick. A couple of candles later, the market had formed a couple more pseudo-inverted hammer formations, and then by the time the market broke above the top of the week of the candlestick with the arrow, the market took off to the upside. This shows just how resilient the buyers had been at that point in time.
Typically, a stop loss is placed at the bottom of the inverted hammer.

Bullish/Bearish Engulfing Candlestick
The engulfing candlestick is simply a candlestick that completely engulfs the previous one. It is also known as an “outside candlestick”, although some analysts differentiate between engulfing candlesticks where the real body engulfs the real body of the previous candlestick, and outside candlesticks. For an engulfing or outside candlestick to form on a higher time frame usually requires takes a wild and volatile session. This candle represents a serious struggle that was finally won by either bulls or bears. It is stronger if the candle closes within the last 20% of the range to demonstrate strong conviction. In other words, in a bearish engulfing candlestick, you want to see it close within the bottom 20% of its range. These candlesticks often signal that there is a move in the direction of the candlestick coming, as momentum builds.
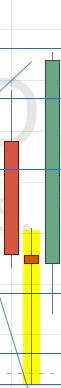
Doji
The doji is the most common of all the candlesticks or candlestick patterns detailed in this article. A doji is simply an indecisive candlestick. In a way, the shooting star and hammer are both specialized forms of the simple doji, just differentiated by the fact that they show exhaustion. A true doji is a candlestick with a range that fails to break in one direction or another. There are many different types of dojis, but in the end they all mean the same thing: indecision. If we get that indecision, it only makes sense that once the price finally makes a move beyond the range of the doji, it means something. In the attached graphic, you can see the doji candlestick formed, and then the breakout over the next session signalled a move higher.
Marubozu
“Marubozu” means “bald man” in Japanese. A marubozu candlestick is simply one that has no wick at the close. While it can have a wick in the other direction, it needs to close at the very high or very low of the candle. The idea behind a “bald man” candlestick is that it has no “hair” (wick).
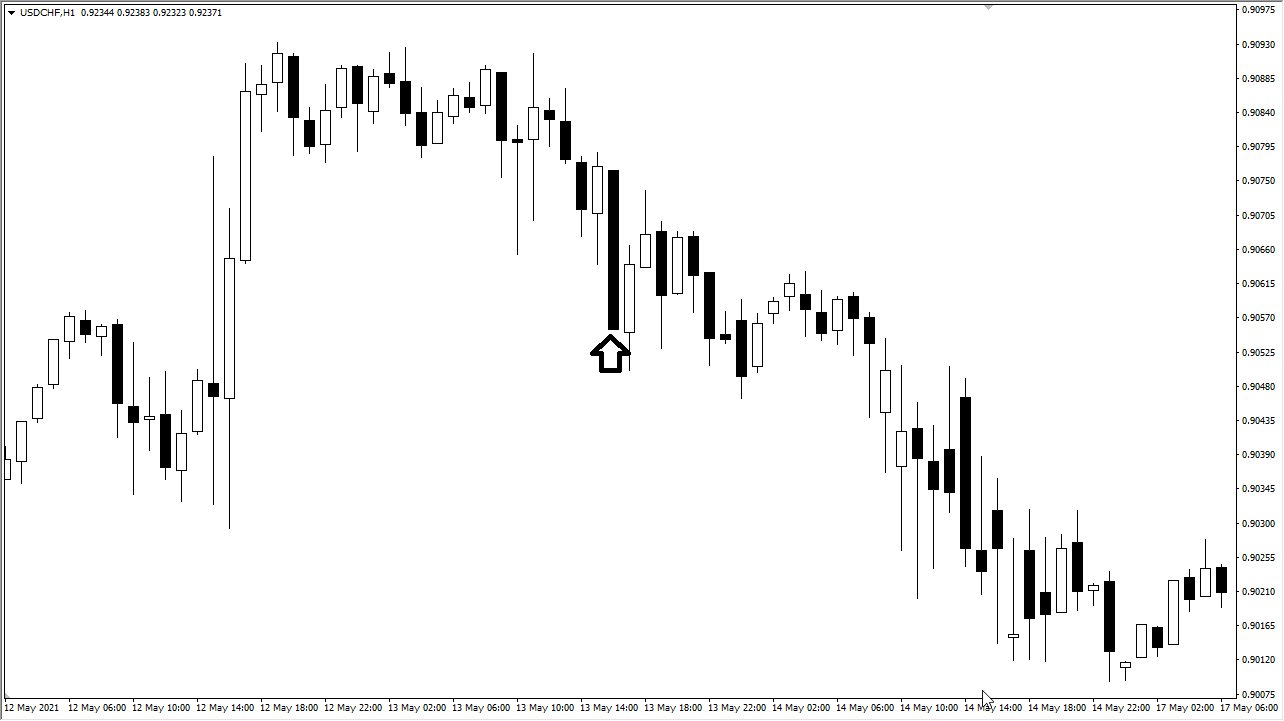
When you think about this candlestick, it does make sense that it is an important one, because it shows that traders were willing to push the market in one direction and perhaps more importantly, hang on to that position as they felt no need to take profit. Within the price chart below, you can see there is a marubozu candle noted by the arrow. The fact that the market closed at the very bottom of the candlestick shows that there is real momentum shifting to the downside. If you put a stop loss on the other side of the candlestick, the market would need to completely change its attitude to take you out of the position.
While it did chop around for a while and certainly attempted to reverse course, you can see that eventually the candlestick in the example shown below could lead to a much bigger move to the downside. These candlesticks are not very rare, but they should be paid close attention to because they do not happen often. This is especially true if you see a daily timeframe close like this, or even weekly. It shows that a lot of traders are very confident in one direction.
Three Candle Reversal
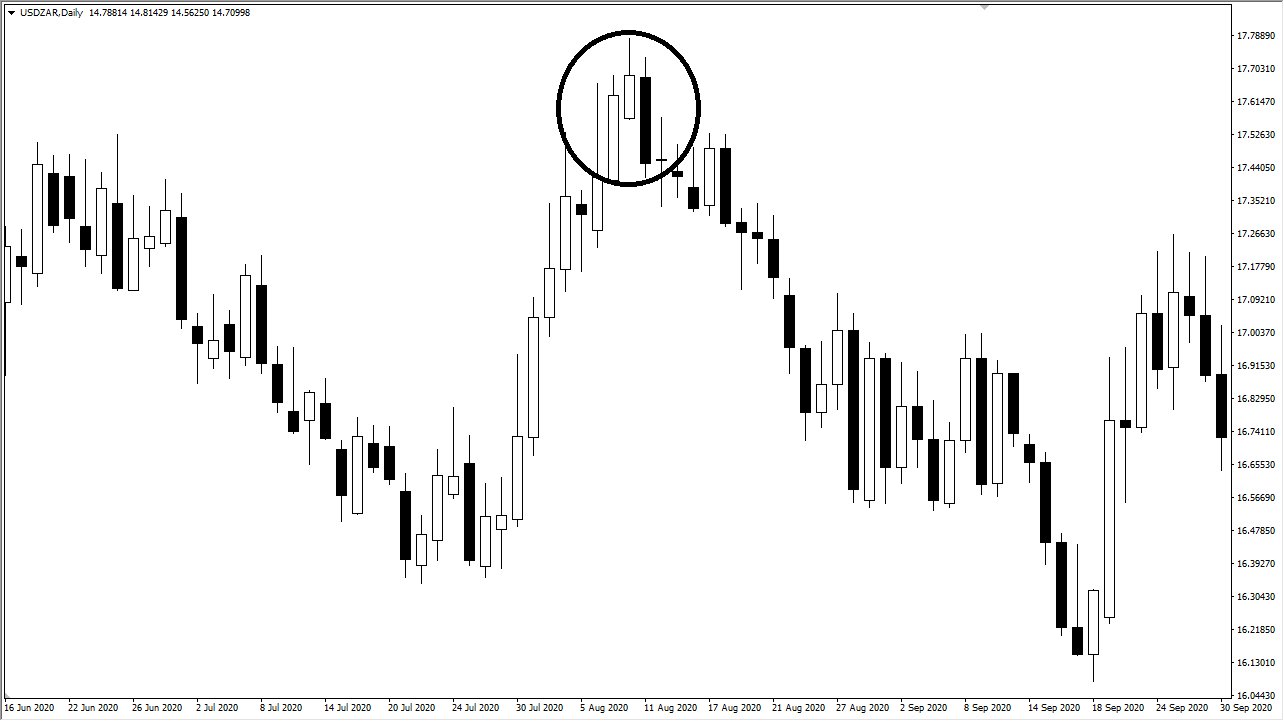
A basic but surprisingly effective candlestick pattern is the “three bar reversal”, also known as the “three candle reversal.” Simply put, it is a pattern consisting of three consecutive candlesticks which show a reversal against the dominant price trend. They can be either bullish or bearish, but the example shown in the price chart below is a bearish reversal.
Note how the market had been in an uptrend for a while, showing multiple bullish days in a row. Look at the three circled candlesticks, showing a clear push to the upside on the first day, followed by a further attempt on the second day, and then finally a selloff on the third day. When traders see that the initial candlestick has broken to the downside, they start selling, as it shows that momentum has reversed from bullish to bearish. The stop loss is typically put on the other side of the middle candlestick, as breaking back above there would show a significant amount of momentum shifting against the potential pattern.
This is a candlestick pattern that is especially sensitive to support and resistance levels, so if you can find such a pattern which is also confluent with a key support or resistance level on a long-term chart, it is more likely to be effective.
Final Thoughts
There are different ways traders can play these Forex candlestick patterns for trade entries or exits when they appear on a live price chart. The most cautious method is to wait to see where the next candlestick closes before taking any action. Traders who are more aggressive will place the trade as soon as the candlestick is broken to the upside or downside, but as you saw in the doji candlestick example above – that would have got the trader into a whipsaw situation. By waiting for the close, the trader would have been more assured that the bullish momentum had built up. Also of note, as with all things technical analysis related, the higher the timeframe in which one of these candlesticks or candlestick patterns appears, the more reliable it is likely to be.
Most of these candlestick patterns detailed above are relatively well known, and of course can be self-fulfilling prophecies as they are so well known and visible. However, no price movement is ever even close to 100% guaranteed, so don’t expect any candlestick pattern to ever be a “dead cert”. Candlestick patterns can tell you where the market either wants to go, or sometimes where it does not want to go. Because of this, you cannot get too hung up on candlesticks being perfect, but rather read what they are generally trying to tell you in terms of the inclination of the price towards its next movement. While there are basic patterns you can work with in a rigid way, there is a certain amount of artistry that comes to reading charts, which can only be fully learned through practice and experience.
FAQs
Which candlestick pattern is most reliable?
If you have any major candlestick pattern forming at an important level of support or resistance, then its odds of being reliable are much stronger. This is the most important thing to keep in mind, that sometimes it is not the pattern itself that matters so much is where the pattern occurs. Overall, shooting stars or hammer candlesticks probably make up most of the most reliable candlestick patterns in Forex.
Do candlestick patterns work in Forex?
Yes. In any market which is relatively liquid, candlestick patterns tend to be relatively useful. As Forex is one of the most liquid markets in the world, candlestick patterns tend to work well in Forex.