

What are Forex Chart Patterns?
Top Forex Brokers
Forex chart patterns (or Forex candlestick formations) are structures of price movements that tend to replicate themselves in different periods and time frames. They respond to specific conditions that produce similar results. In that line, traders follow those patterns to identify trading opportunities.
Forex chart patterns are based on technical analysis, and they represent price actions and specific pair behaviors previously classified by historical movements and context. They help traders identify market sentiment, mode, direction, and entry and exit points for trades.
Types of Forex Chart Patterns
The number of patterns that can potentially be identified within a single price chart is vast. It can even grow every day as new assets, pair behaviors, and financial instruments are continuously created. In other words, as the market evolves with the passage of time, so do chart patterns.
However, there are three popular types of Forex chart patterns that traders pay most attention to and it is therefore a good idea to focus on these.
1. Continuation chart patterns – indicates price likely to continue moving in same direction.
2. Neutral chart patterns – indicates price likely to continue to range (consolidate).
3. Reversal chart patterns – indicates price likely to change direction.
Of course, there is no tool than can tell you with 100% certainty what is going to happen in any market. As traders, we try to identify hints that, when aligned, show us potential market directions. When clear Forex trading patterns arise, they are accurate more often than not, but they can also fail. So, trade responsibly and use risk management tools.
Let us explore these types of Forex chart patterns.
Continuation Chart Patterns
As its name suggests, continuation chart patterns are price formations that signal the dominant trend should continue if the pattern requirements are fulfilled. Continuation formations usually happen when the pair consolidates recent runs. They can offer good opportunities because “the trend is your friend”.
When these chart patterns occur, they suggest that investors are taking a breath before resuming the ongoing trend. Trends rarely express themselves in direct straight lines, instead tend to make lots of retracements and zigzags.
The most popular Forex continuation chart patterns are flags, rectangles, pennants, and directional wedges.
Reversal Chart Patterns
Forex reversal chart patterns are formation which suggest winds of change have arrived on a price chart. These chart patterns indicate that the dominant trend is coming to an end.
Among popular reversal patterns are head and shoulders, double tops, double bottoms, triple tops and bottoms, and directional wedges.
Neutral Chart Patterns
Also known as bilateral chart patterns, these price formations happen in both trending and ranging markets. The key element here is that these Forex chart patterns can move the price in either direction after a trigger occurs.
Popular neutral chart patterns include both symmetrical and asymmetrical triangles.
Top Chart Patterns Every Trader Should Know
Now we can talk in detail about the most popular patterns commonly seen in Forex charts.
Head and Shoulders (H&S)
Head and shoulder formations are reversal chart patterns. These can be found as the top of an uptrend or as the bottom of a downtrend, with the latter known as an inverted head and shoulders. It signals a change in trend direction from bullish to bearish or vice versa depending upon whether it is occurring in an uptrend or in a downtrend.
When it acts as a topping pattern, the price structure shows three peaks; the first and the third peak are similar in height, while the second is the highest. It signals a bullish to a bearish trend change.
In traders' words, the first and the third peaks are known as the shoulders, and the second is the head. Then, the neckline is the bottom after the first and second peaks. The signal comes when the price action breaks below the neckline after the third peak.
Some traders state that the neckline should be strictly horizontal, but others prefer to also consider necklines that are not equal. In that case, if the neckline slopes down, it signals bearishness. In the other case, if it goes up, it signals bullishness.
When trading this popular chart pattern, the entry point is located after the break of the neckline following the third peak. Stop loss can be placed either above the second shoulder or above the head. The profit taking target level will be determined by measuring the height of the pattern between the neckline and the head, and then adding that number of pips from the opening price. In simple terms, the profit target will be the same height as the pattern.
On the other hand, please pay attention to the wider location of this or any other Forex chart pattern as it could face strong resistance or support. Obviously, if a pattern had developed and you are getting 75% of the profit target just ahead of a strong resistance, take your money and secure your profit.


Double Top
The double top chart pattern signals a reversal as it takes two rejections of a similar resistance area and suggests price exhaustion. It describes a price movement that makes two peaks following strong trending moves.
The signal comes when the price fails to break above a level twice and falls below the valley's bottom between the two peaks, also called the neckline. The position is opened after the price breaks below the neckline as a rejection of the second peak. Then, the profit target is set by the distance between the tops and the neckline.
Obviously, you can revise your position once it is completed and let it go for further gains. You can also close before a critical level if it has gone close enough to the profit target. Remember, reading Forex chart patterns is not an exact science.
If you are a conservative trader, you can wait for a second confirmation in the form of a retest of the neckline from the other side, which should hopefully then act as a resistance level.

Double Bottom
The double bottom chart pattern is a formation that combines two bottoms and a peak between them. It signals a reversal from a bearish trend that turns into an uptrend. When the price is falling, it fails to break below a price level twice, and it breaks above the level of the first retracement following the second bottom.
The position is opened when the price breaks above the neckline after the rejection of the second bottom. Then, the profit target is set by the number of pips between the bottoms and the neckline.
As always, you can revise your position once the trading plan is completed. You can also close the position before the target price is reached if you see strong resistance ahead.
For a more conservative approach, wait for the rising pair to get back to retest the neckline which should have become support.

2b Breakout
A “2b Breakout” is really just a double top or bottom, but one where the second top or bottom quickly exceeds the high or low of the first top or bottom before reversing very quickly and strongly. It is a failed breakout, and the faster and more dramatic its failure, the better.
Now of course technically, every double top or bottom is a 2b breakout if the second top or bottom exceeds the first one by any measure at all. However, we can usually distinguish “true” 2b breakouts by the fact that there is a candlestick wick making the breakout, followed immediately by a strong candle in the opposite direction. The example of a triple top shown above is a fairly good example of a 2b failed breakout on the third top: note the strongly bearish candlestick immediately following the break.
This pattern is the most common of all the patterns covered in this article. For that reason, be careful in picking which ones you will trade. They ideally will fall at price extremes which are rarely touched.
Quasimodo (Over & Under)
This pattern is a triple top or bottom, but one where the middle top or bottom is lower than the other two bottoms (if it is a bottom) or higher (if it is a top). This can be a very powerful pattern and is often nested within other similar, longer term compounded candlestick formations.
An example is shown in the Gold chart below:

Referencing the numbers marked in the chart above, at 1, we can see the price made a bottom, which had greater validity as it made another low after the spike before rising again. At 2, the price made a low just barely below that slower low within the structure at 1: a double bottom. However, within the second, longer-term bottoming, we can see almost equal but higher lows (compared to the low at 2) which are shown at 3 and 4. If the price were now to rise suddenly, it would be based off both a double bottom and a Quasimodo, as well as a very short-term double bottom at 4.
Here, a long entry would have made sense when the price broke up quickly to at least $1335, with the stop loss placed just below either the lowest low at $1331 or alternatively the most recent low at about $1331.40.
Often, the best and most effective compounded candlestick formations include several elements all within the same structure, giving them greater power to push the price in the same direction.
Square Root
A square root is a low followed by two higher but equal lows: equal to each other. In the other direction, it would be a high followed by two lower but equal highs. It is called a “square root” as its shape mimics the mathematical symbol for square root.
An example of a bearish square root formation is shown in the below chart of the GBP/USD currency pair:

At the high marked as (1) in the chart above, we have a high, then at (2) and (3) we have nearly equal lower highs that presage a strong downwards move.
Note that it is also more or less a Quasimodo / over and under pattern too.
Here, a logical short entry would have been at around 1.3275, with the stop loss placed just above the double top at 1.3345.
Ascending Triangle
As continuation patterns, ascending triangles talk about two different forces working simultaneously in a chart. It always happens, bulls versus bears, but with ascending triangles, the bears are located in a very concentrated area, while bulls are buying in the development of an uptrend.
This advanced forex chart pattern happens when a pair follows a rising trendline. Still, the unit starts a consolidation phase at a certain point, failing to make new highs as the unit is rejected several times in the same area.
The entry signal comes when the Forex pair breaks above the triangle's upper side, which triggers a rally. The profit target is then set taking the number of pips between the initial low of the triangle and the break level. That number is added to the entry price level, and the sum will give you the profit target.
Of course, the pattern fails if the price action falls below the upward sloping trendline instead of breaking above the triangle.

Descending Triangle
Descending triangles are another type of continuation pattern. Obviously, these are the opposite of ascending triangles. These occur when a Forex pair is in a downtrend and then begins a consolidation phase. Then, after breaking the triangle to the downside, it triggers a further renewed downwards movement.
The signal is generated when the pair breaks below the supportive lower line of the triangle. The profit target goes with the sum of the pips between the triangle's initial high and the breaking point, from the price at the entry position.
The pattern is generally deemed to fail when the price action goes above the sloping downwards trend line instead of breaking below the triangle.

Symmetrical Triangle
A symmetrical triangle is a Forex trading pattern that traders try to identify in any timeframe. It is among the most common neutral chart formations, and it can provide either a bullish or bearish entry signal.
A symmetrical triangle happens when two trend lines are converging in the chart. Usually, an uptrend connects a series of higher lows, and a downtrend connects a series of lower highs.
The signal comes when the pair breaks above or below the symmetrical triangle pattern. Profit targets would result from the sum between the low or high of the triangle and the price where the position is entered. That number of pips is added to the opening price, and the result is the profit target.
The stop loss is placed at the previous meaningful low or high before the break, depending on the position's direction. The pattern fails when the triangle comes to an end, and the price action remains in a neutral stance or range bound

Engulfing Pattern
Engulfing patterns are popular among candlestick chart users as it goes into the chart's intrinsic nature. They can work in all time frames and can be easily identified. It suggests an immediate and strong change in the direction of the Forex pair.
In an uptrend, this signal comes when a declining candle body completely engulfs the prior rising candle body. In a downtrend, the call comes when a rising candlestick body engulfs the previous down candle.
The position is opened after the engulfing candle is completed and a new candle is generated. It trades in the closing direction of the engulfing candle. The stop loss is set below the low or above the high of the pattern.
Although there is no widely accepted profit target in this trading chart pattern, there are two popular ways to determine a profit target.
Firstly, you can use the same chart pattern to identify subsequent trend changes and close the position. Secondly, you can combine it with another strategy or technical levels, such as Fibonacci, support and resistance, or round numbers, to set a take profit target.
Finally, this chart pattern can also be used as an exit strategy for other running trade positions as it suggests a change in the odds of the pair from continuation to reversal.

Rising Wedges
Wedges are advanced forex chart patterns that work with a series of price movements limited by converging trend lines. A wedge can be either rising or falling depending on the movement's direction and are popular among Forex traders as having a good track record as price reversal signals.
A rising wedge happens when a trend is moving between two parallel lines that are converging slightly. It is formed by a series of higher lows and higher highs.
The entry signal comes when the price action falls below the rising wedge's bottom line and performs a candle close below that breaking level. Then, the pair should retest the support previously broken that is now acting as resistance as confirmation.
The entry point is set at the confirmation level. Stop losses are usually placed at the swing high previous to the break. The wedge chart pattern offers extra profit-taking options depending on the strength of the break. As a profit level, you can select any preliminary support set when the formation developed.

Falling Wedges
As the opposite of rising wedges, the falling wedge chart pattern occurs when a downtrend moves between two semi-parallel lines. It is a succession of lower highs and lower lows in which bears are initially in control.
The entry signal is generated when the price action breaks above the falling wedge's top line and closes the period above that given line. Then, the pair should retest the resistance previously broken that is now acting as support. This will be your confirmation.
The entry point is set at the confirmation level. Stop losses are usually placed at the low previous to the break.
The wedge chart pattern offers several potential take profit target levels depending on the strength of the break. You can select any preliminary resistance tested when the pattern was forming.
How to Read Forex Chart Patterns in Trading
Forex chart patterns are powerful graphical representations of what is going on in the market. They help to identify potential movements and profitable trades. They represent a market's technical conditions in real time and tell you what the market is doing right now.
As traders, we do not know for sure what will happen in the future, but we look for hints that align in the same direction so that we can open and close positions with some confidence that the odds are on our side. The idea behind chart patterns is that statistically, prices make structures, and those structures anticipate reactions. Patterns give us hints.
However, the art of how to read forex chart patterns is incomplete if you do not apply other studies such as volume (not always possible in Forex), risk/reward ratio, and some fundamental factors.
The first step to trade a chart pattern is to locate a price structure that complies with all requirements for that formation. Do not cheat by trying to force it because the market will make you pay. A good chart pattern jumps out at you, you do not have to look for it too hard.
After identifying the pattern, you should consider how much money you are willing to put at risk and how much your reward will be. Experts tend to recommend a 1 to 3 risk to reward ratio, which means that you will get three pips for each one you put at risk if the trade works out in your favor.
Now that you have your trading plan designed, please examine wider market conditions, volume in the pair, and independent aspects that can affect your trade. Such movements can be a significant economic event, fundamental factors, or a considerable resistance or support line just in front of the pattern.
Finally, follow your trading plan. Show respect for your analysis and follow profit targets and stop losses. You can obviously do extra research once your targets are reached and adapt yourself to any change in market conditions. Let your winners run and cut your losses.
Pros and Cons of Forex Chart Patterns
As you may know, Forex trading is not an exact science; neither are the investment markets. With that in mind, we should understand that no strategy can guarantee a 100% winning formula. Like most things in life, popular chart patterns and formations have advantages and disadvantages.
Pros of Chart Patterns
- Statistically, chart patterns provide hints on what a Forex pair will do in the near future.
- Chart patterns offer full trading plans, including opening price, take profit targets, and stop losses.
- You can add other studies for confirmation and the chart should still work correctly.
- It is easy to learn and understand how to read Forex chart patterns.
Cons of Chart Patterns
- It takes time for chart patterns to form.
- Not all chart patterns work in more than two different time frames.
- Subjectivity can play a principal role in patterns localization.
- Chart patterns can deliver false signals.
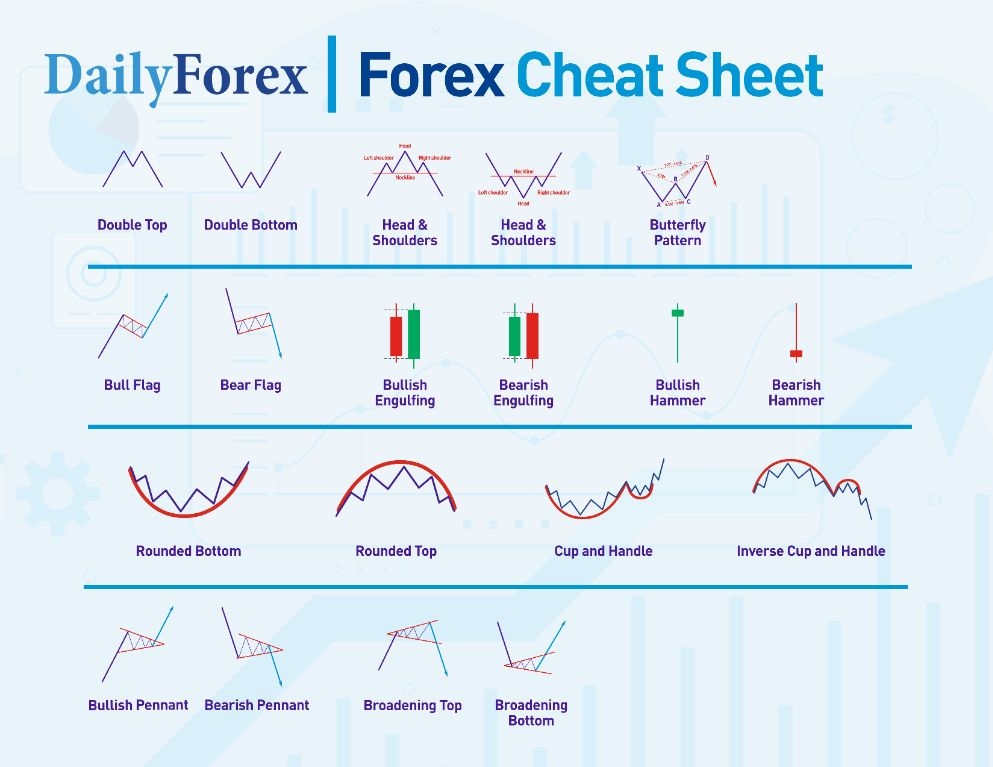
What is a Forex Cheat Sheet?
Forex technical analysis offers Forex traders some great tools to help them navigate the market.
A “Forex Cheat Sheet" summarizes some of the most essential ideas traders use to analyze the currency markets and make trading decisions. It's an easy, quick-reference guide to pull up and see common chart patterns.
Below, I've explained some of the most valuable technical indicators likely to be found on a Forex cheat sheet:
Head & Shoulders
The Head and shoulders pattern is one of the most robust reversal patterns in technical analysis.
Formation of a Head & Shoulders pattern:
- The pattern starts when the price makes a high, which is called the left shoulder.
- The first high is followed by a higher one, the head.
- Lastly, the price makes a lower high, which is the right shoulder.
The low points between the highs are called the neckline. The pattern is complete once the neckline breaks.
Swap the highs for lows to see an inverse Head & Shoulders pattern.
What makes a good Head & Shoulders pattern?
- When a Head & Shoulders pattern appears after an uptrend, or an inverse Head & Shoulders appears at the bottom of a trend
- When the Head & Shoulders pattern takes time to unfold on the chart
- When the pattern has a clear neckline
- I prefer a horizontal neckline.
Rising & Falling Wedges
A wedge is a triangular formation where the two lines of the triangle point up or down in the same direction.
The best places for wedges to appear are after a trend has started, as the wedge will either reverse the trend or continue it.
Rising wedges:
- A rising wedge is a bearish pattern.
- If a rising wedge appears after an uptrend, it is a reversal pattern. The wedge should be quite large to help reverse the trend.
- If it appears during a downtrend, it is a continuation pattern.
Falling wedges:
- A falling wedge is a bullish pattern.
- If a falling wedge appears after a downtrend, it is a reversal pattern. The wedge should be large to help reverse the trend.
- If it appears during an uptrend, it is a continuation pattern.
Double Tops & Bottoms
These patterns are simple to identify on a chart. When Double Tops & Bottoms appear on the chart, the price will move in the opposite direction.
Double Top: The price makes two highs near the same price level (looking like the letter “M”). A Double Top is a bearish pattern.
Double Bottom: The price makes two lows near the same price level (looking like the letter “W”). A Double Bottom is a bullish pattern.
Like all chart patterns, market context matters. If a Double Top or Bottom is near a previous support or resistance level or comes after a trend is in place, indicating a reversal, the pattern is much more powerful.
Before entering a Double Top, wait for the price to break the low that connects the two highs. Or, before entering a Double Bottom, wait for the price to break the high that connects the two lows.
Bull & Bear Flags
A flag is when the price moves in a parallel upward or downward range.
Bull flag: the price moves downwards in a parallel range. The best time for a bull flag to appear is during an uptrend.
Bear flag: the price moves upwards in a parallel range. The best time for a bear flag to appear is during a downtrend.
Engulfing Patterns
An engulfing pattern is two candles with bodies in opposite directions, and the second candle’s body covers the price range made by the first candle’s body.
Engulfing patterns are reversal patterns.
Bullish engulfing: a red candle immediately followed by a green candle whose body covers the price range of the first candle.
Bullish engulfing: a green candle followed by a red candle whose body covers the price range of the first candle.
Like all chart patterns, market context matters. For example, the setup is much more powerful if an engulfing pattern appears near a previous support or resistance level.
Butterfly Pattern
The Butterfly pattern is a five-point reversal chart pattern with Fibonacci percentages connecting the points.
It is a part of the Harmonic family of chart patterns.
The Butterfly pattern is one of the most complex patterns in technical analysis, and it takes a lot of practice to spot. Many traders use software to recognize Butterfly patterns and other Harmonic patterns on the chart.
The Cup and Handle
The Cup and Handle pattern consists of a rounded bottom immediately followed by a pull-back or smaller rounded bottom at the end of the first rounded bottom. The shape looks like a cup with a handle.
The Cup & Handle is a popular pattern in stocks to show heavy accumulation of the stock (for example, buy institutions) buying before the price rockets up. Like many technical patterns, it can be reversed to become a bearish pattern and used across different markets.
Pennant
A pennant is a symmetrical triangle that appears after a swift move up or down.
It represents a pause in the market as if taking a deep breath before continuing. It provides one of the safest entry points after a rapid price move.
Broadening Top
A broadening top or bottom is an expanding triangle before the price reverses.
The best place to see them is after a trend. However, broadening tops or bottoms represent expanding volatility, so they can be tricky to enter.
Hammer
This is a single candlestick setup with a small body at one end of the candle (either near the top or bottom) and a long tail. The pattern represents a rejection of the price near the candle’s tail.
The best place to trade Hammers is near support and resistance levels, as the tail of the Hammer represents the price bouncing off that support or resistance level.
Rounding Bottom
A rounded bottom shows the market slowly turning from bearish to bullish sentiment.
It’s a powerful reversal pattern as the “bottoming” formation represents multiple touchpoints from the price, creating a solid support or base.
Final Thoughts
Should you use Forex chart patterns in your trading? It depends on what you are more comfortable with and what adapts better to your trading profile. The good thing with chart patterns is that several formations serve different needs and trading styles.
Before going live trading chart patterns with real money, test them in Forex demo accounts so you can identify opportunities, adaptations, and problems with those price structures.
Following longer-term compounded candlestick patterns on higher timeframes such as the hourly chart, using a zoomed-out chart, can lead to much greater accuracy and an ability to cherry-pick a higher percentage of truly profitable trades. It can be difficult to find many trades that line up precisely at predetermined support or resistance levels, which is why using compounded candlestick formations to determine where support and resistance has been found can be a more fruitful trading methodology.
Keep in mind that additional research is needed to identify which Forex trading patterns work better in different pairs and timeframes. Remember, no market is the same as another, and not all timeframes are equal. Many expert traders will only trade chart patterns on higher time frame charts.
FAQs
How to read forex chart patterns?
Reading forex chart patterns is easy, but it requires some discipline and self-control. First, study the top price formations and then explore your charts to identify potential patterns. However, do not cheat. Forex trading patterns answer specific conditions. Do not try overly hard to identify a pattern, the good ones will jump out at you.
Are chart patterns always right?
No. There is nothing 100% correct in trading, and Forex chart patterns are not an exception. The best way to trade them is to find a second indicator that confirms the price formation.
How can I make money with forex chart patterns?
Chart patterns are one of the few ways to make money in Forex. However, you should learn everything about the chart pattern and then test it in demo accounts or historical charts before going live. Popular chart patterns will provide you with ample opportunities to make money, so be focused on mastering all of them.
Should I use stop losses with advanced forex chart patterns?
You should always use stop losses when trading Forex. Every chart pattern will provide you with logical technical price points at which to place stop losses and profit targets.
What is the most successful pattern in Forex?
The Head & Shoulders and Cup and Handle patterns are two of the most successful patterns in Forex.
How do you master a Forex chart pattern?
Look at examples online, practice looking for patterns on many charts, and demo trade the patterns.
What is the best way to learn Forex patterns?
Look for patterns on as many charts as possible, and look at other people’s examples online, for example, in trading forums.
Do patterns work in Forex?
Yes. Chart patterns work in technical analysis and Forex, but they take practice to use.