

What is a Forex Trading Strategy?
Every Forex trading strategy has three elements:
Rules to enter a trade.
Rules to exit if a trade goes against you, i.e., a stop loss.
Rules on where to take profits.
When you have those three parts, you have a complete trading strategy.
Top Regulated Brokers
So, a Forex trading strategy is a decision-making process for entering and exiting the market. But are the strategy rules fixed? Or do they have room for interpretation? A trading strategy with fixed rules is a “systematic” trading strategy, and a strategy where you can interpret the rules and use discretion is called a “discretionary” strategy.
Beginners looking to understand trading strategies should know firstly that all trading strategy rules are based on one of two big analytical styles: technical analysis or fundamental analysis.
What’s Technical Analysis?
Technical analysis uses price and volume data to make trading decisions. For example, identifying support and resistance levels is part of technical analysis, and indicators based on price such as moving averages are also part of technical analysis.
What’s Fundamental Analysis?
Fundamental analysis uses economic or financial data. For example, if you’re analyzing how a country’s interest rates might affect its currency value, that’s fundamental analysis. Another example of fundamental analysis is looking at a company’s earnings to determine if the share price may go up or down.
Most Forex trading strategies use technical analysis, and for that reason, I’m going to focus mainly on technical analysis in this article.
Price Action Trading
Price action trading relies only on looking at a price chart with no indicators to make trading decisions. If you think you can’t trade without indicators, remember that indicators are just derived from price. Price action trading is the purest form of technical analysis, but it’s the most subjective and takes a lot of practice to master. So, why consider price action trading? Because it can adapt to any market condition and asset class. It has stood the test of time—having been used over decades by traders around the world.
I think price action trading can be a great Forex trading strategy for beginners because it can teach you essential principles of technical analysis that will help you become a successful trader.
Let’s look at some of the main concepts behind price action trading.
A key concept in price action trading is that higher timeframes will dominate lower timeframes. If you see an uptrend on a higher timeframe, for example, the daily chart, but see a downtrend on the hourly chart, the chances are the daily chart will win out in the end.
Support & Resistance (S/R)
The best place to start analyzing a price chart is to mark support and resistance levels. It gives you a map of where the price could move and where it can stall. Price can establish a support or resistance level by just one touch or multiple touches.
Chart Patterns
You often see repeating patterns in price charts, and these are known as chart patterns. There are three main categories of chart patterns: reversals, continuation/ranges, and trends.
- Trends. Correctly identifying trends and entering them is the foundation of many traders’ profits. It’s such a crucial part of price action trading that I have given the topic a separate section in this article.
- Reversals. When a trend ends and reverses direction into a new trend, the area between the two trends creates “reversal patterns.” As price forms a reversal pattern at the end of the trend, it can give you advance notice of the new trend. Reversal patterns are great for helping you enter the market near the beginning of a trend—something that is notoriously hard to do. Common reversal patterns are head and shoulders, double/triple tops or bottoms, and rounded tops and bottoms.
- Continuation/Ranges. Triangles and sideways ranges can indicate a pause or reversal in the trend. That means some continuation/ranges can become reversal patterns depending on how the price moves afterwards. If a triangle or sideways range appears in a trend, the price is more likely to resume its original direction if that triangle/range is small. If the range is large and the price moves wildly, there is a greater chance that the price will reverse or at least not continue the trend. Of course, many traders wait for the price to break out of a range to give them more certainty.
Candlestick Patterns
There are types of candlesticks that can indicate future price movement. An example is the pin bar candle: this candle has a small body in the top or bottom third of the entire candle’s length, and the candle has a long tail. A pin bar indicates a reversal. I would not trade enter a trade just because I saw a pin bar candle, but if it is rejecting a support or resistance level, it could provide me with an attractive entry point.
The Best Forex Trading Strategies
S/R Role Reversal Strategy
A trading strategy I call “Support & Resistance Role Reversal” is the best Forex trading strategy for any beginner to master. This strategy’s set-up happens when a support or resistance level is broken and then re-tested from the other side.
Let’s say the market is trending up:
The price breaks a resistance level,
The price then dips back down after breaking the resistance.
It creates a support at the same level as the prior resistance. This is the “role reversal,” and it confirms the trend and gives you an entry into the market.
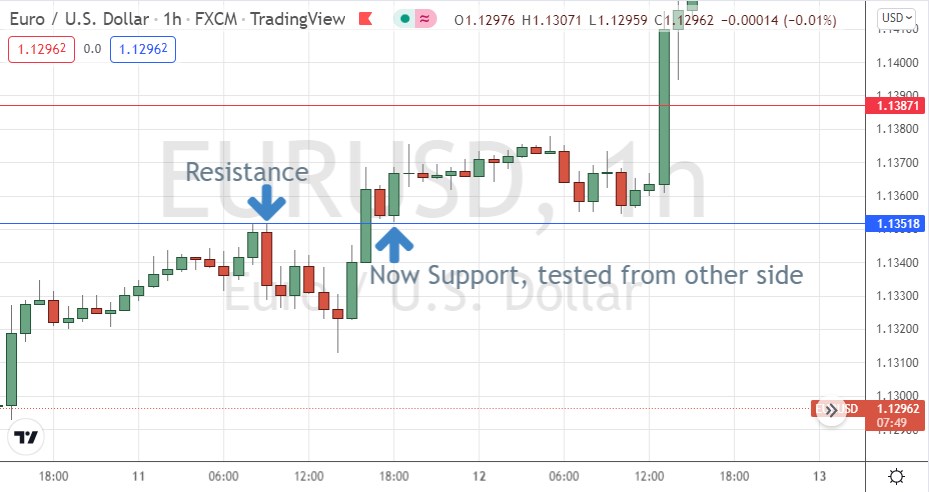
Support/Resistance Role Reversal Chart
You can also use this concept if the market leaves a trading range and momentarily tests the broken range from the other side. The level flips from support to resistance (for short trades), or from resistance to support (for long trades).
Trend Trading Strategy
Rule #1. The trend is your friend.
This phrase has been around for as long as technical analysis has existed. My most profitable trades have been from riding a trend, and if you ask many other traders, they’ll often say the same thing. Trading in the direction of the trend offers some clean moves with good risk reward ratios. Some traders will trade against the trend on smaller timeframes, but others avoid countertrend trading altogether because it means trading against the direction of the established market momentum.
Your ability to capture trends as part of your trading strategy will be crucial to your profitability. Let’s talk about some basic trend principles.
What’s a trend?
An uptrend is a series of higher lows and correspondingly higher highs. A downtrend is the opposite of an uptrend – it’s a series of lower highs and lower lows.
When is a trend over?
An uptrend is technically over when the most recent low is broken. When that happens, it doesn’t mean the price will necessarily reverse or go down; in fact, the uptrend may even resume. However, this initial segment of the trend has stopped because of the break of the most recent low, and you should re-examine the market. For a downtrend, when the price breaks the most recent high, the trend is broken.
Higher timeframe trends are more stable.
A trend on a 5-minute timeframe can reverse much more quickly than a trend on a daily timeframe.
A trend should be obvious—otherwise, it’s not there.
Most of the time, a market isn’t trending. If you’re a trend trader, be patient and wait for the price to meet your entry criteria. In other words, wait for a trend to appear that is unambiguous. A good trader is willing to be patient and wait until the right time to enter the market.
You can enter a trend on a pullback, especially on smaller timeframes.
In any trend, you’re going to get small pullbacks against the direction of the main trend. These can provide excellent spots to enter a trend. For example, if you see a trend on the daily chart, look at the hourly chart for a pullback or retracement to place an entry order.
Steep trends are liable to snap back.
Trends have a habit of accelerating into a frenzy that can produce steep moves. When that happens, you often get equally steep retracements that shake out some traders. Psychologically, it’s tempting to chase a trend when it’s steep because you’re afraid of missing out on the move. Yet in those moments, unless you see a good risk reward ratio, it’s probably better to stand back and let the market play out until it becomes more stable.
The three most popular trend trading indicators: Moving Averages, MACD, and RSI
Moving Averages. These are popular partly because they are so easy to understand! You can use a single moving average line to help indicate if the price is in an uptrend or downtrend or use moving average crossovers to indicate potential changes to short- or long-term trends. For example, the 50 & 200 Exponential Moving Averages (EMAs) are a popular combination on daily charts. If the 50 EMA falls back across the 200 EMA, you can use that as an objective signal that the trend is over. The problem with moving average strategies is that they are terrible in ranging or choppy markets where they crisscross all the time. You should always interpret moving averages alongside price action to give context. Let’s say you are in an established uptrend: at that point, it’s helpful to see when moving averages cross to suggest the uptrend is pausing. Yet if you have been in a sideways range for a while, moving averages are of little value.
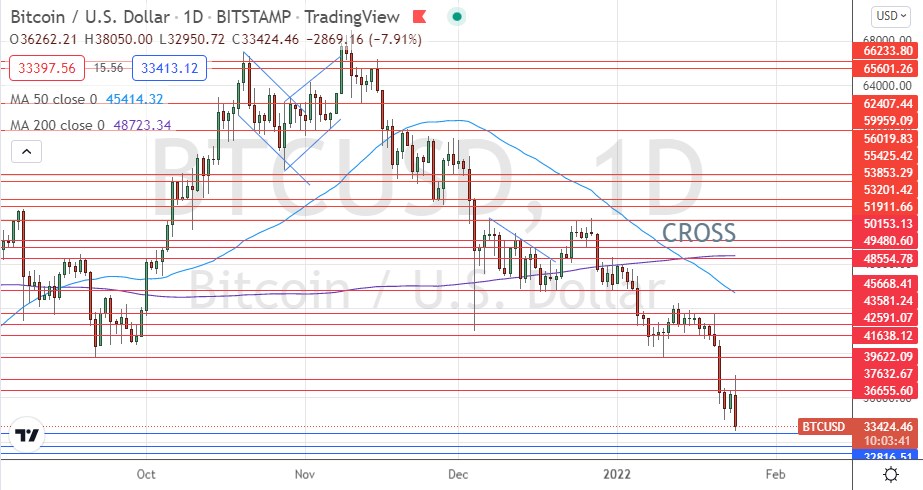
50-Day Moving Average Crosses Below 200-Day Moving Average
MACD (Moving Average Convergence Divergence). The MACD measures the difference between two moving averages and plots it as a histogram or bar chart below the price chart. The longer the MACD bar, the stronger the trend. MACD is great as a divergence indicator—e.g., if the price makes a higher high, but the MACD makes a lower high, it can mean the uptrend is losing momentum.
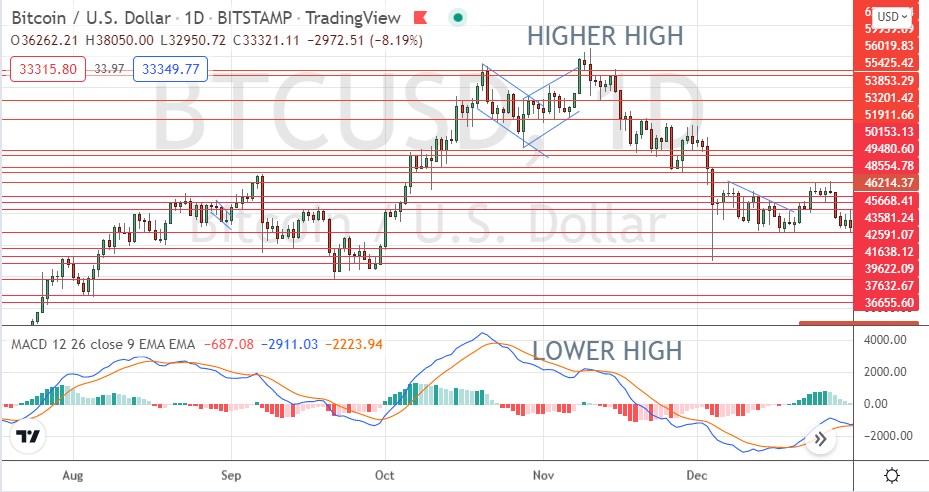
MACD Divergence
RSI, (Relative Strength Indicator). RSI is a momentum indicator that measures the magnitude of recent price changes to signal overbought or oversold conditions. The RSI indicator ranges from 0 to 100, and you can choose where to set overbought and oversold levels. The most common overbought/oversold level settings are 80 and 20 and 70 and 30. For example, if the price is at a new high but the RSI is at 80 or above, you could be expecting a pullback. You can also use RSI as a divergence indicator. Let’s say price makes a higher low, but the RSI doesn’t make a higher low. This could mean the trend is losing strength.
Range Trading
A price range is when the market is trading sideways between two clearly defined support and resistance levels. Range trading is a trading style which tries to take advantage of a ranging situation by going long near the support, or short near the resistance.
Some traders will only trade the range in the direction of the longer-term trend. Let’s say the price had been trending up before it created the range, such traders would only look for a long trade, entering when the price hits the support level of the range because they want to be aligned with the direction of the longer-term momentum.
Range Trading Tools
- Price Action & Candlesticks. Experienced traders are comfortable using price action without indicators. They will mark their support and resistance levels and perhaps monitor multiple timeframes and candlestick patterns to enter the market.
- RSI & Stochastic Oscillator. These are the most popular indicators for range trading. They show when the price is overbought or oversold. Let’s say the price is coming to the bottom of the range. An oversold RSI reading can help confirm that this is a good time to enter a new long position in the hope the price will remain within the defined range and start rising in price.
Position & Swing Trading
Position trading and swing trading are trading styles defined by how long the trade is intended to last. Swing trades last a couple of days to several months, and position trading from several weeks to months or even years. These aren’t strict definitions, and some might say a one-month trade is too long to be a swing trade. Here I put position and swing trading in the same category because the same principles apply to both.
One of the myths about technical analysis is that it’s only for short-term trading. You can also apply technical analysis to longer-term trades. For example, suppose you have a fundamental analysis view on the market, for example, a strengthening economy that may benefit a particular currency. A swing or position trade would be an ideal way to exploit this because economic catalysts can take weeks or months to play out in the markets. But when the new fundamental conditions eventually impact the markets, they can create long-sustained trends.
Pros:
- Flexible schedule and screen time. With swing and position trading, you can choose the time of day to do your trading. This flexibility means you can fit your trading around your lifestyle, family and work commitments. Many people with full-time jobs begin Forex as position or swing traders.
- Single monitor. It’s easy to swing or position trade using only one monitor, for example, a laptop screen. You don’t need multiple monitors to view different timeframes simultaneously.
- Trading psychology. Psychologically, it’s usually easier to manage longer-term trades because you don’t have the rapid sequences of emotions you would undergo in day trading. However, longer-term trades do give you more time to worry. It depends on your individual psychology.
- More trading opportunities / selectivity. A swing or position trader would normally look at higher timeframes, such as H4 or D1. Higher timeframes give you ample time to examine more charts. Also, some instruments which are unsuitable for short-term trading because of cost or liquidity can often be traded successfully over the longer-term with swing or position trading. Having more potential opportunities means you can be very selective and take only the best opportunities. This is one of the reasons that swing or position trading strategies can be the best Forex trading strategies for beginners.
- Cost of trading. If you’re a short-term trader looking at a 20-pip profit target on a Forex pair, a 2-pip spread is significant to overall profitability. But if you’re a long-term trader looking for 200 pips of profit, the spread becomes insignificant. Swing or position traders are therefore not very worried about taking high spread Forex trades common in exotic currencies or certain other currency crosses.
Cons:
- Takes longer to compound profits. One of the biggest disadvantages to swing or position trading is how long it can take to realize profits. You can be in trades for weeks or months. The size of the trades may be larger in terms of pips or points. However, they may not yield larger percentage profits on your account compared to short-term trades.. Day traders can rotate their capital quicker and therefore compound their accounts faster.
- Cost of carry. This is the amount of additional money you might have to spend to maintain a position. It can be overnight swaps, or interest payments on margin Forex accounts due to leverage. If you’re holding a position over weeks or months, the daily cost-of-carry charges can be very significant and eat away at your profitability.
Forex Day Trading Strategies
Day trading means opening and closing trades within the same day or the next day at the very latest.
Most day traders use technical analysis rather than fundamental analysis as technical analysis is more important over the short term. The economic calendar is still important to day trading though because it gives day traders an idea of which Forex pairs might move that day and at what time.
Day traders are looking for repeatable intraday patterns. They normally use the 5-minute or 15-minute charts to find trade entries and analyze a higher timeframe, such as H4 or D1 charts, to understand the larger trends and market conditions. Day traders execute between 1 and 5 trades a day on average, although there is no hard rule for number of trades.
Pros:
- More activity. More trades can help compound money a lot quicker.
- Income. Opening and closing trades regularly can help you draw regular income from your trading activity.
- Quicker learning. You find out very quickly if a strategy works or not, and you can see the results of any adjustments almost immediately.
- No cost of carry. If you are not holding trades overnight, you do not have overnight financing issues.
Cons:
- It’s the market’s schedule, not yours! As a day trader, you must be available when the market is moving. In the case of Forex, that’s usually the London open or New York open. This may not be convenient for you depending upon your time zone.
- Spreads & Commissions. More activity means you pay more in spreads & commissions.
Now let’s look at the details of a few trading strategies.
The London Breakout Trading Strategy
The “London Breakout” is the most famous and easily learned day of all the Forex day trading strategies. It is timed for the London open when a flood of liquidity hits the markets after the quieter Asian session. Forex pairs such as the GBP/USD, which often trade within tight ranges during the Asian session, can begin predictable trends at the London open. There are several variations on this strategy, but they are all based upon the idea that major Forex currency pairs involving European currencies such as the GBP/USD and EUR/USD often find their day’s direction soon after the London open.
Forex Scalping Strategy
Scalping is a trading style in which a trader can be in and out of trades within seconds or minutes, looking to capitalize on very small price movements. In Forex, this usually means anywhere from 5 pips to 15 pips.
The difference between general day trading and scalping may not seem like much, but the compression in time creates a giant leap in the skillsets and strategies used. Scalping requires split-second timing and an extremely strong ability to focus.
Scalping also requires superior technology, particularly a fast internet connection, a fast computer, and multiple monitors.
Most scalpers will have a very specific strategy that they follow every day without deviating. Remember, you won’t have time to think through different scenarios if you are operating second-to-second, so you must be able to act instantly.
Finally, scalpers are very sensitive to broker execution speeds and spreads. Even an extra half a second in execution speed or half a pip in spreads matters a lot to scalpers.
Many scalping strategies are based upon identifying support or resistance levels and taking a scalp trade when the price bounces off them.
Carry Trading Strategy
A carry trade in Forex is buying a high interest rate currency with a low interest rate currency. The idea is that each day you hold the trade open, your broker will pay you the interest difference between interest rates. Importantly, your broker would pay you the daily interest on the leveraged amount. For example, if you have a one mini-lot trade for $10,000 of currency but use $250 of margin, you should get paid the interest difference on $10,000.
The risk with a carry trade is that the Forex pair’s price goes against you, wiping out the interest payment and more. For example, if you are long a Forex pair, it could fall in value by more than the interest payout. Ironically, the currency pairs with the highest interest rate differentials tend to be the most volatile, thereby increasing risk. The best scenario is a carry trade where you believe the Forex pair you are holding will also move in your direction.
Carry trading has become very difficult in the post-2008 low interest rate era as interest rate differentials are low between most currencies. Another big problem is that almost all Forex brokers heavily tilt the interest rate payouts in their favor, so even when you are long a high rate and short a low rate, you will usually have to pay the broker something every night, and not the other way around.
Pros:
- Interest rate payment. You will get the interest rate payment on the leveraged amount, regardless of how the currency pair’s price moves.
Cons:
- Exchange rate risk. If the Forex pair goes against you, it can wipe out profits and even put you at a loss.
Retracement Trading
A retracement is when the price turns and moves against its initial direction of movement. Let’s say that the price moves up 200 pips and then moves down 100 pips, the retracement is 100 pips, or 50%. In retracement trading, you wait for the price to make a dip (the retracement) against the trend, and then enter a trade back in the direction of the original trend.
Fibonacci retracement levels provide a basis for helping to estimate how far a retracement might go. The two most important levels are 50% and 61.8% of the original move. 50% is not strictly a Fibonacci level but is known as the halfway back level. 61.8% is the Fibonacci “golden ratio”. There are other Fibonacci levels, such as 38.2% for shallow retracements and 78.6% for deeper retracements.
Some traders use Fibonacci in isolation, and some will use other indicators in conjunction with Fibonacci to help them navigate price action.
I’m a fan of using Fibonacci without other indicators because it is inherently different from other tools: Fibonacci forecasts where price may turn. Other indicators make calculations on recent price data and are lagging indicators.
Pros:
- Fibonacci. It’s a fantastic forecasting tool that doesn’t lag price the way other indicators do.
Cons:
- It’s an imprecise art. You must decide where to place your Fibonacci levels for the upper and lower limits of the “original move” i.e., the 0% and 100%, which can be highly discretionary in some cases.
Grid Trading
Grid trading is unique because you’re not making a call on whether the price will go up or down. Instead, you’re putting in advance orders above and below the current price to capitalize on both scenarios.
There are many ways to grid trade. You can use support and resistance levels above and below the price to place orders or place a row of distanced orders. When the price moves, it will pick up the orders.
The basic idea is to buy when the price is relatively low and sell when the price is relatively high, compared to recent price action. This is essentially a mean-reversion trading strategy, but it can incorporate elements of trend as well.
If this sounds very easy, it’s not. Prices are often messy in their movements. It can move up, then down to pick up an order in the opposite direction, then back up again, and so on.
Pros:
- Market direction neutral. You’re not looking to predict which way the market will go.
Cons:
- Potentially multiple filled orders. If the price chops around and doesn’t find a clear direction at some point, you might end up sitting on several filled orders on both sides of the market, which could create a series of losses.
News Trading
Forex has an established calendar of news announcements, and you can rank them in order of impact. For example, the US Federal Reserve’s monthly policy release including the interest rate and economic forecast is the most important scheduled such events. Other central banks also have scheduled announcements on interest rates that predictably impact that country’s currency.
You can use these scheduled news announcements and the expectation of volatility that they create to plan trades.
Pros:
- Scheduled volatility. You know in advance there’s a high likelihood that specific currency pairs will move at expected times.
Cons:
- News events can be surprising. There’s often a consensus of what a news announcement will be in advance, but these can be entirely off target.
- Erratic price movement. As markets digest news and orders hit the market, the price can whipsaw around erratically. You could be correct on the overall direction but get stopped-out because of the volatility.
- Spreads increase. Spreads are usually very high around a news announcement. Some brokers either do not allow trading close to a scheduled news event, or even if allowed, trade execution can be very poor or unpredictable.
Bottom Line
Every Forex trader needs a Forex trading strategy, even if some parts of it are left to the trader’s discretion.
There are many types of trading strategy for Forex traders to choose from. All technical trading strategies are based upon one of two ideas: that prices will eventually revert to their mean, or that strong directional momentum is likely to continue. Traders can take elements from all kinds of different trading strategies and piece them together to form their own unique strategy. Forex trading strategies also do not need to have all entry and exit rules clearly defined: it is possible for a skilled trader to use a defined system but then to apply their own sense of the market as a filter, making a final discretionary call over whether to pay attention to a trade entry or exit signal generated by their trading strategy. Beginner traders will do better to use a trading strategy with clearly defined entry and exit rules, recording their expectations about each trade, and then checking to see whether they were right. The more correctly a beginner trader can make these calls, the more ready they are to start to use discretionary elements in their trading strategy.