I consider myself a technical trader, which means I use technical analyses and price charts instead of news items and economic indicators like interest rates, CPIs, etc. However, I do make sure to always start off my analyses with a glance at the economic calendar, so I can gauge the direction of the markets and what is moving them.
Another thing that I think is important to do when conducting a market analysis is setting your timeframes and knowing how to use them. Personally, I split my timeframes into what I call “higher timeframes” and “lower timeframes”. Any chart that is from the four-hour timeframe or longer I consider to be a higher timeframe, and any chart from one-hour or below I consider to be a lower timeframe. I then use the higher timeframes for my technical analyses and the lower timeframes for my actual trade execution when I’m looking for a good trade entry.
Let's jump in to our weekly analysis of the major Forex pairs, starting with the EUR/USD.
EUR/USD
On the weekly chart, the uptrend that started in early 2020 has stalled as the price reaches a previous resistance formed in early 2018:
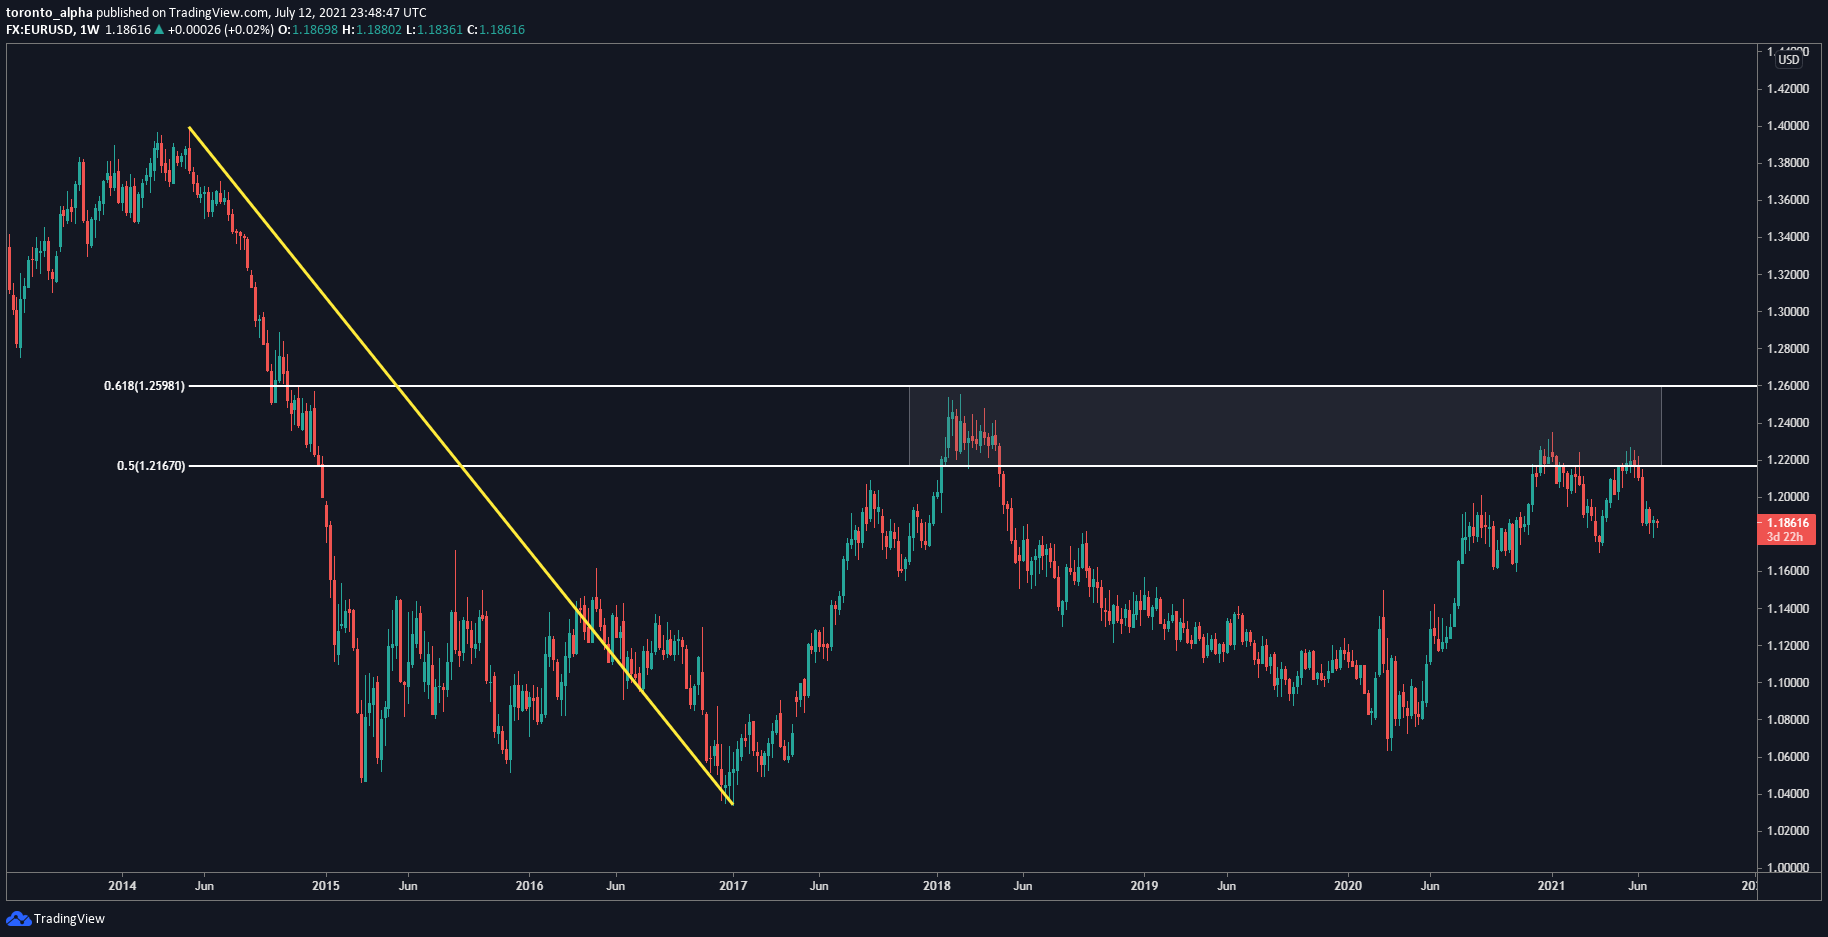
This resistance also is in a significant 50-61.8% retracement zone. The price made a lower high this year, giving it a nearly double-top formation.
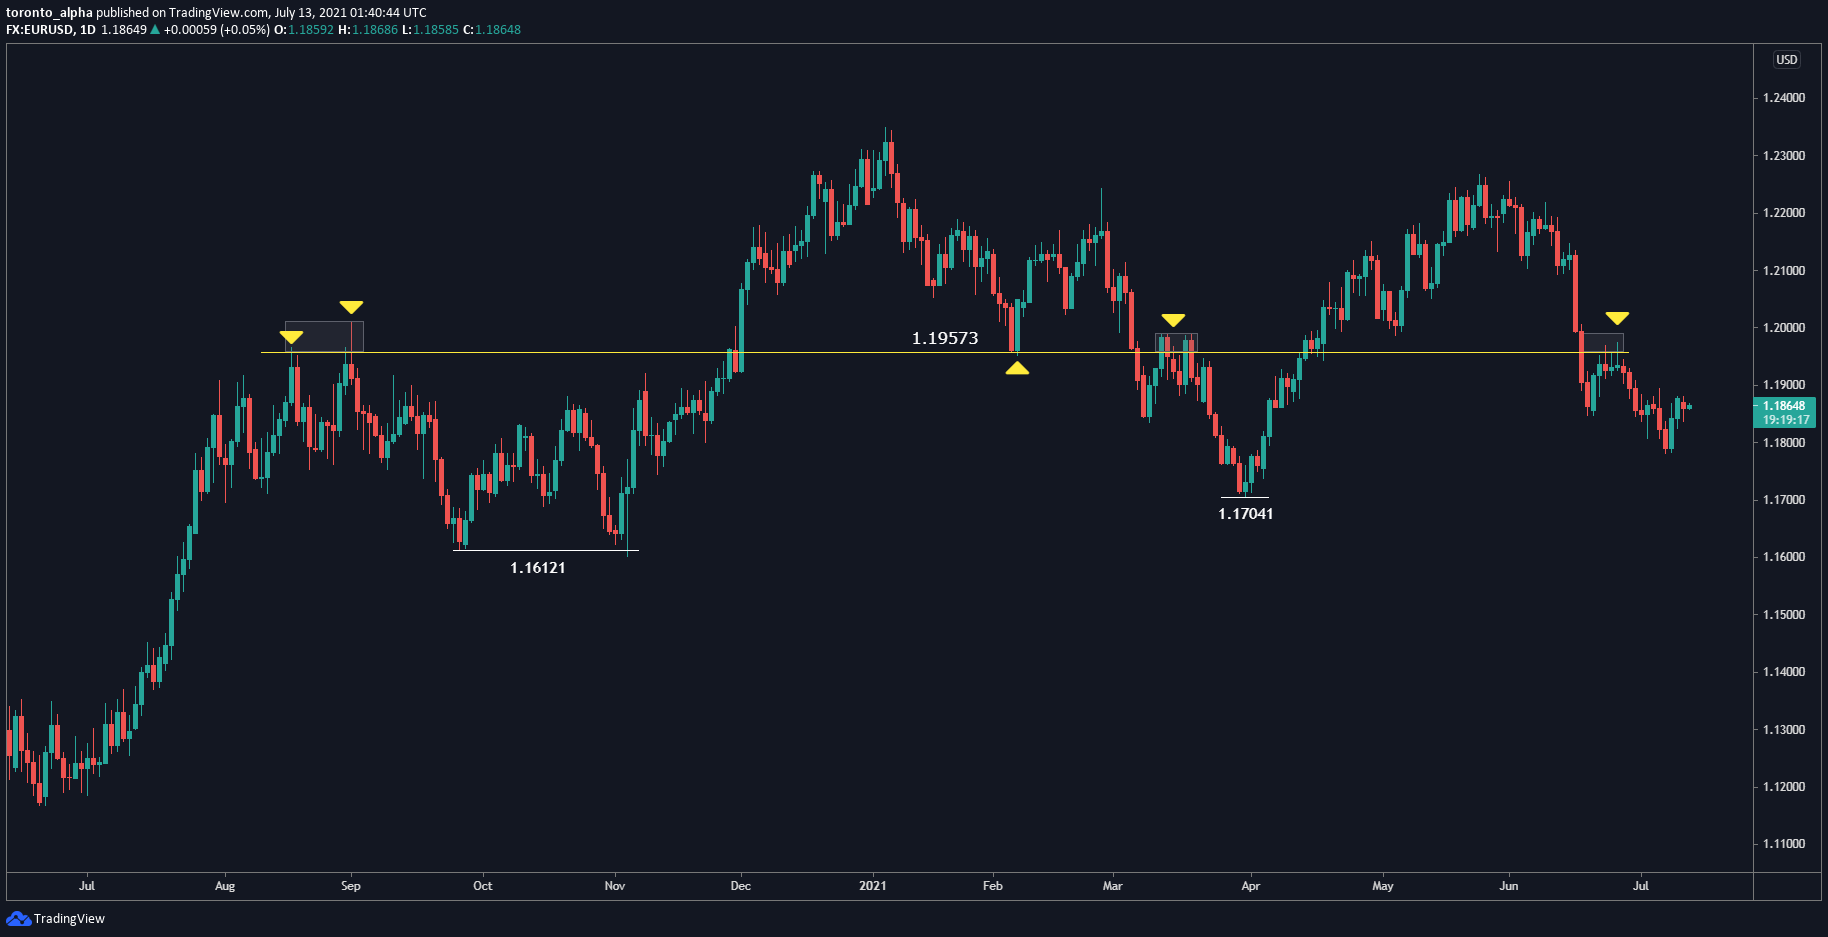
The price tested 1.19573 as resistance on the daily timeframe, which has acted as a resistance and support over the last 12 months. The next support levels the price could reach if it continues trending down are 1.17041 and 1.16121.
GBP/USD
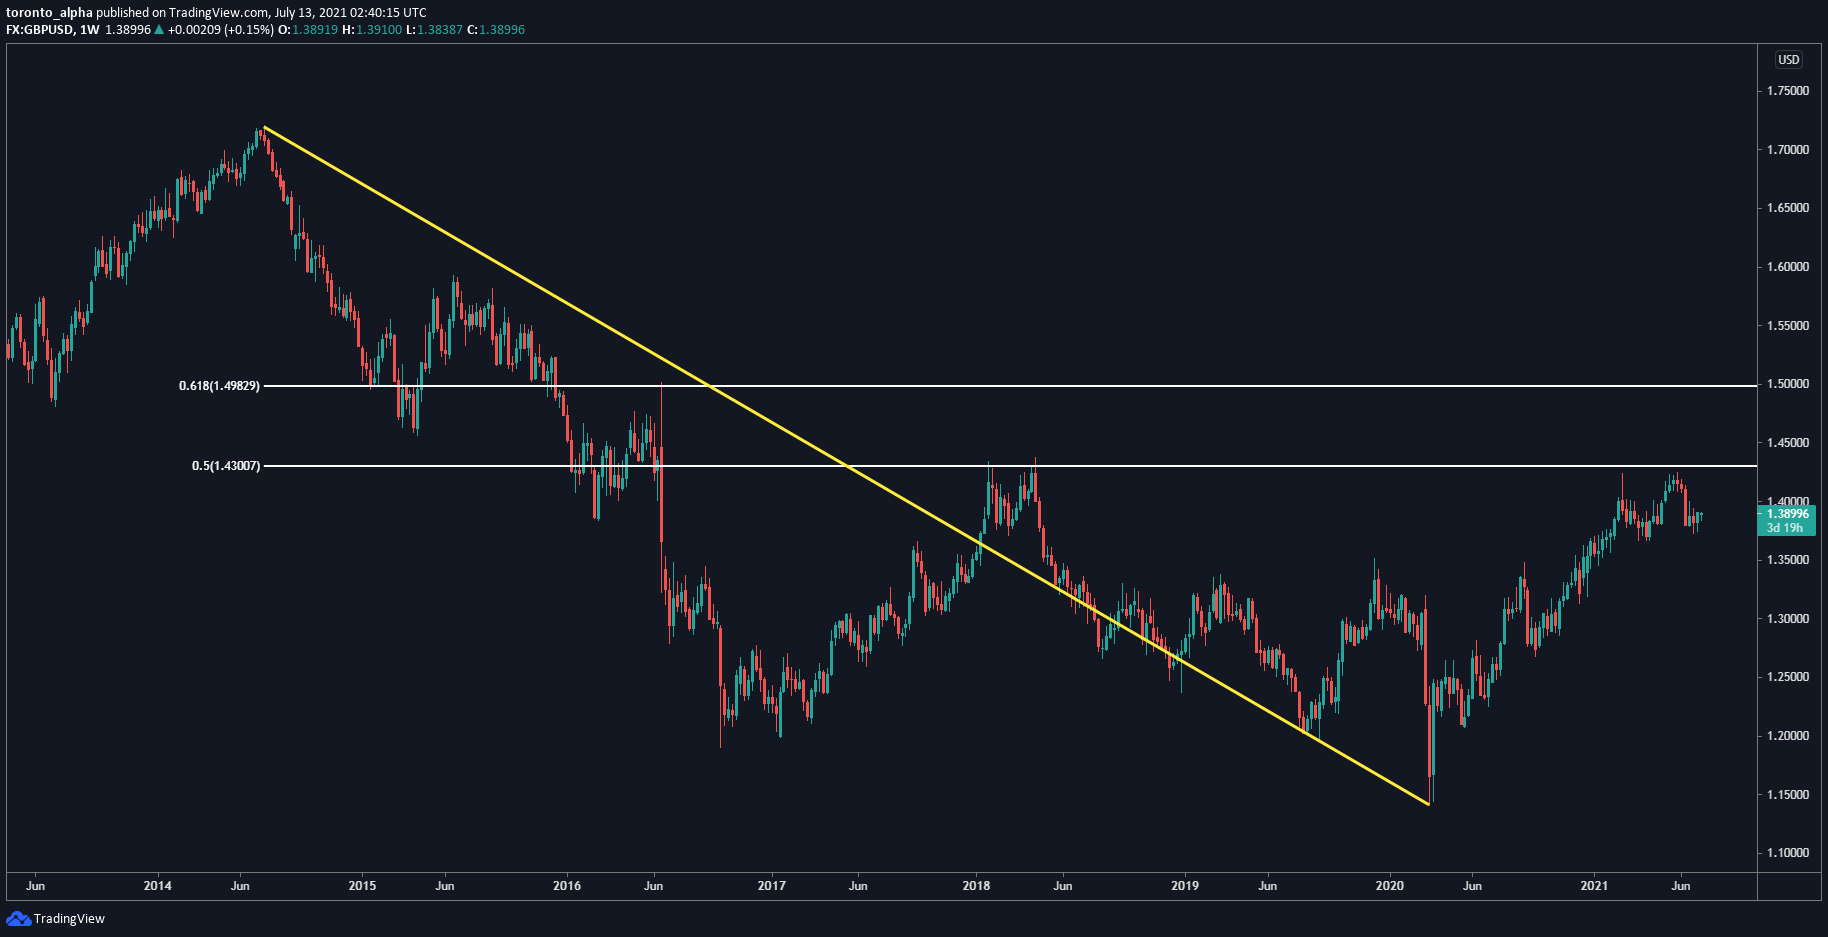
The GBP/USD is in a similar state to the EUR/USD, with its uptrend that started in early 2020 now slowing down as it comes in the same region as resistance made in early 2018. That resistance level is also at a significant 50% retracement level.
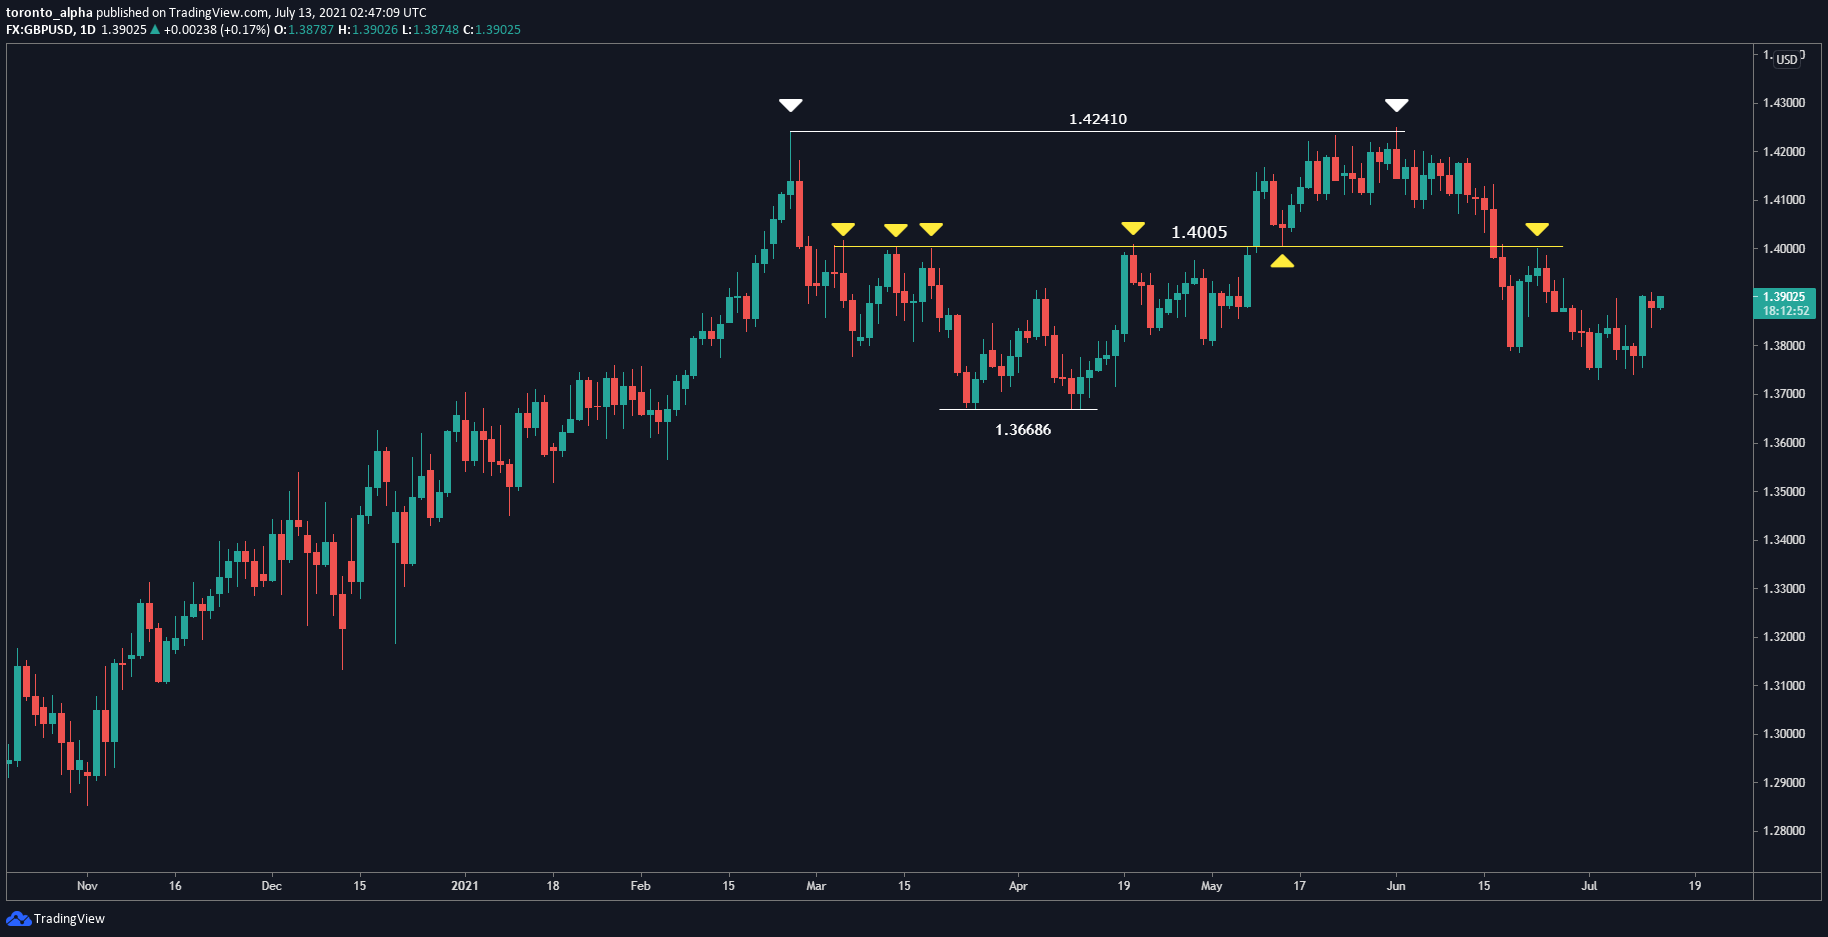
On the daily chart, a double top has formed at 1.42410. The 1.4005 level is now resistance again:
USD/CHF
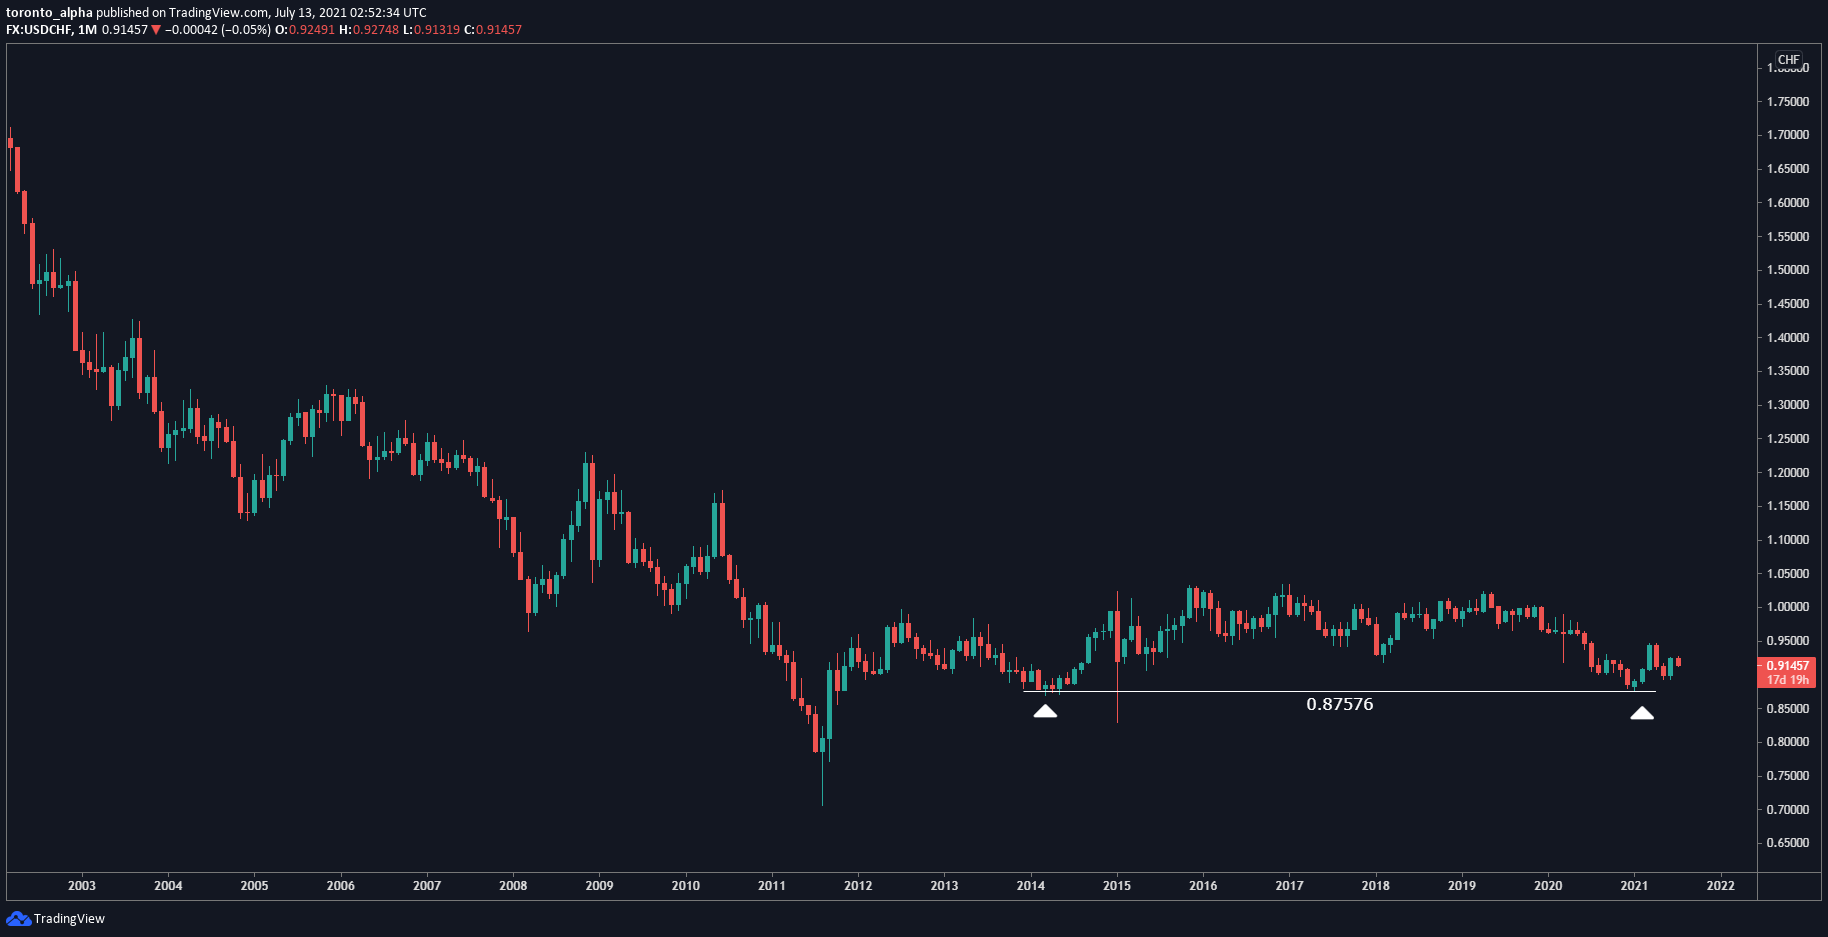
The USD/CHF bounced and created a support level at 0.87576 earlier in 2021, which aligns with a previous support in 2014.
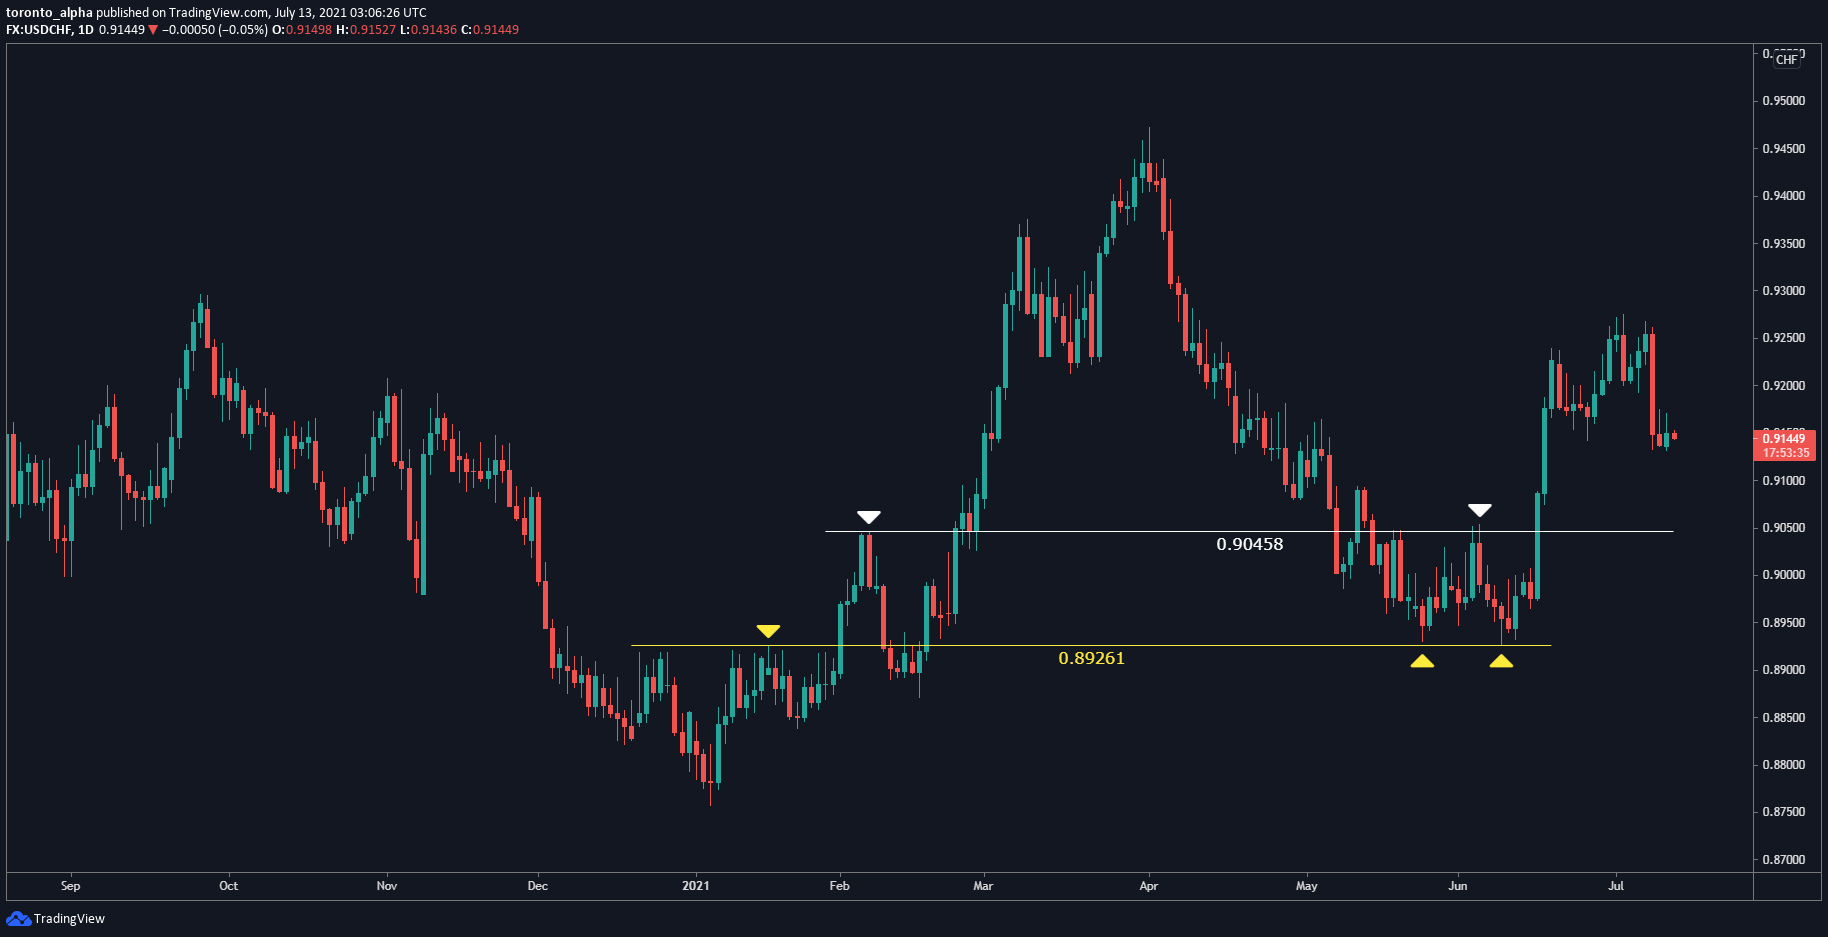
On the daily chart, the price has the potential to retrace to 0.90458 and even 0.89261 before resuming a bullish path:
USD/CAD
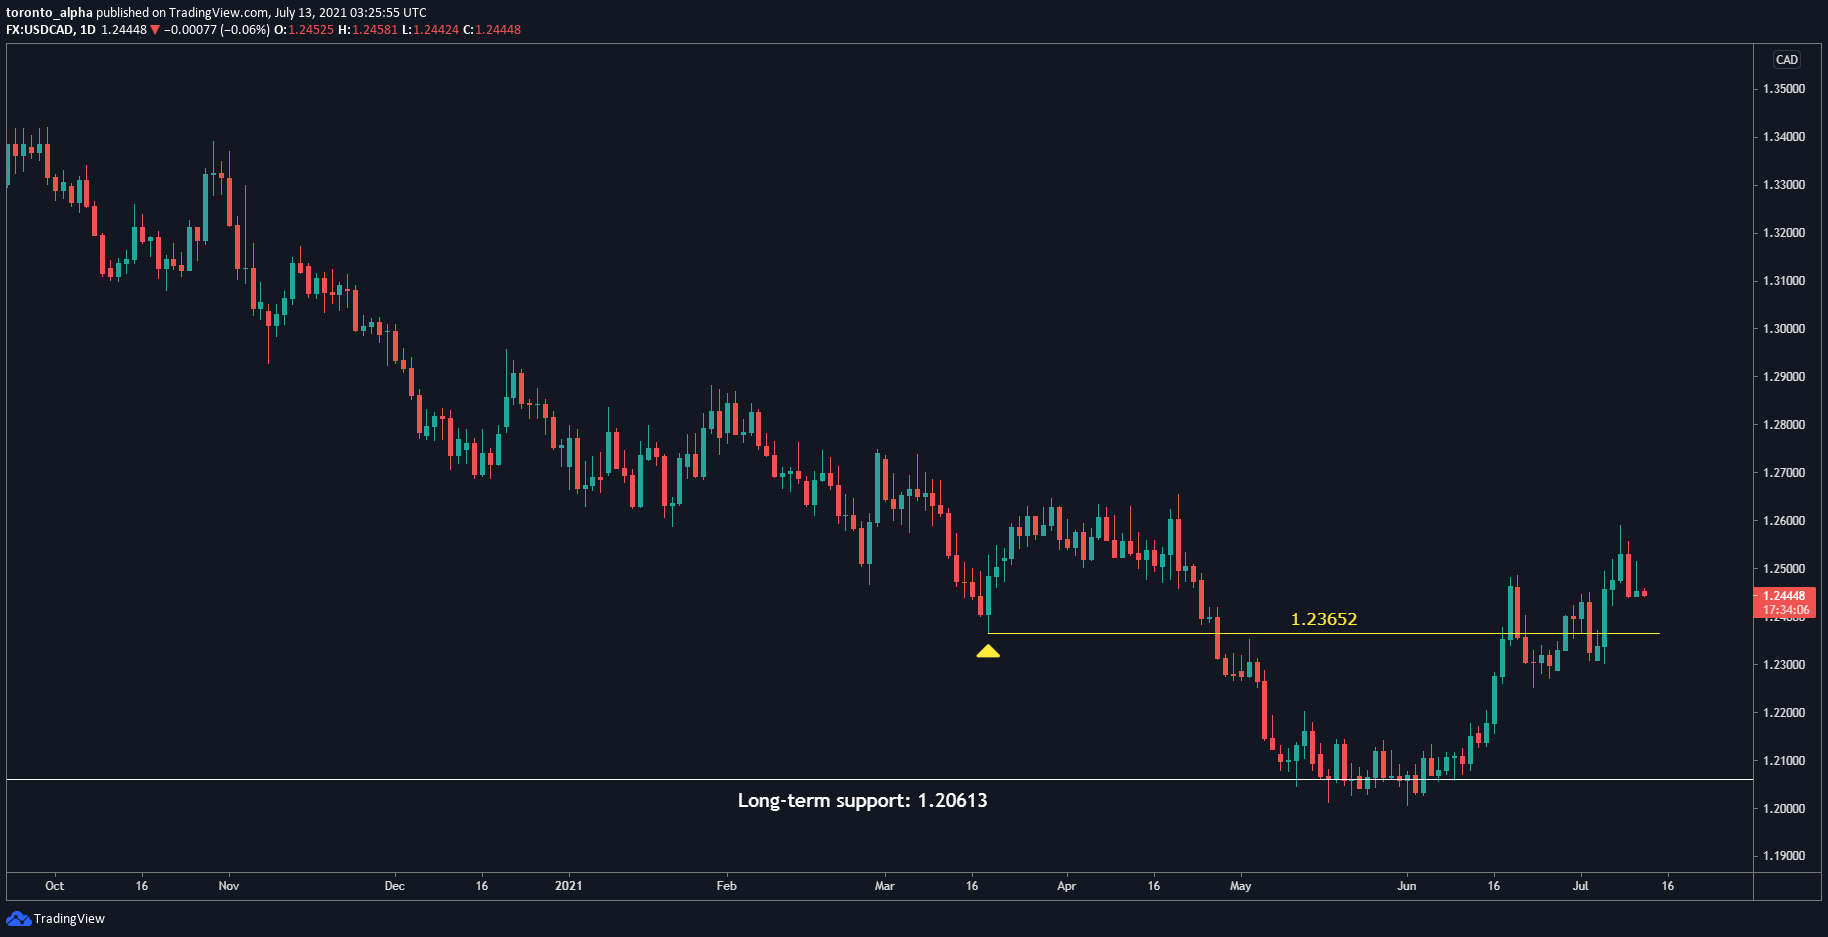
The USD/CAD recently bounced off a support level made in 2017 at 1.20613, and the price could be reversing the previous 18-month downtrend.
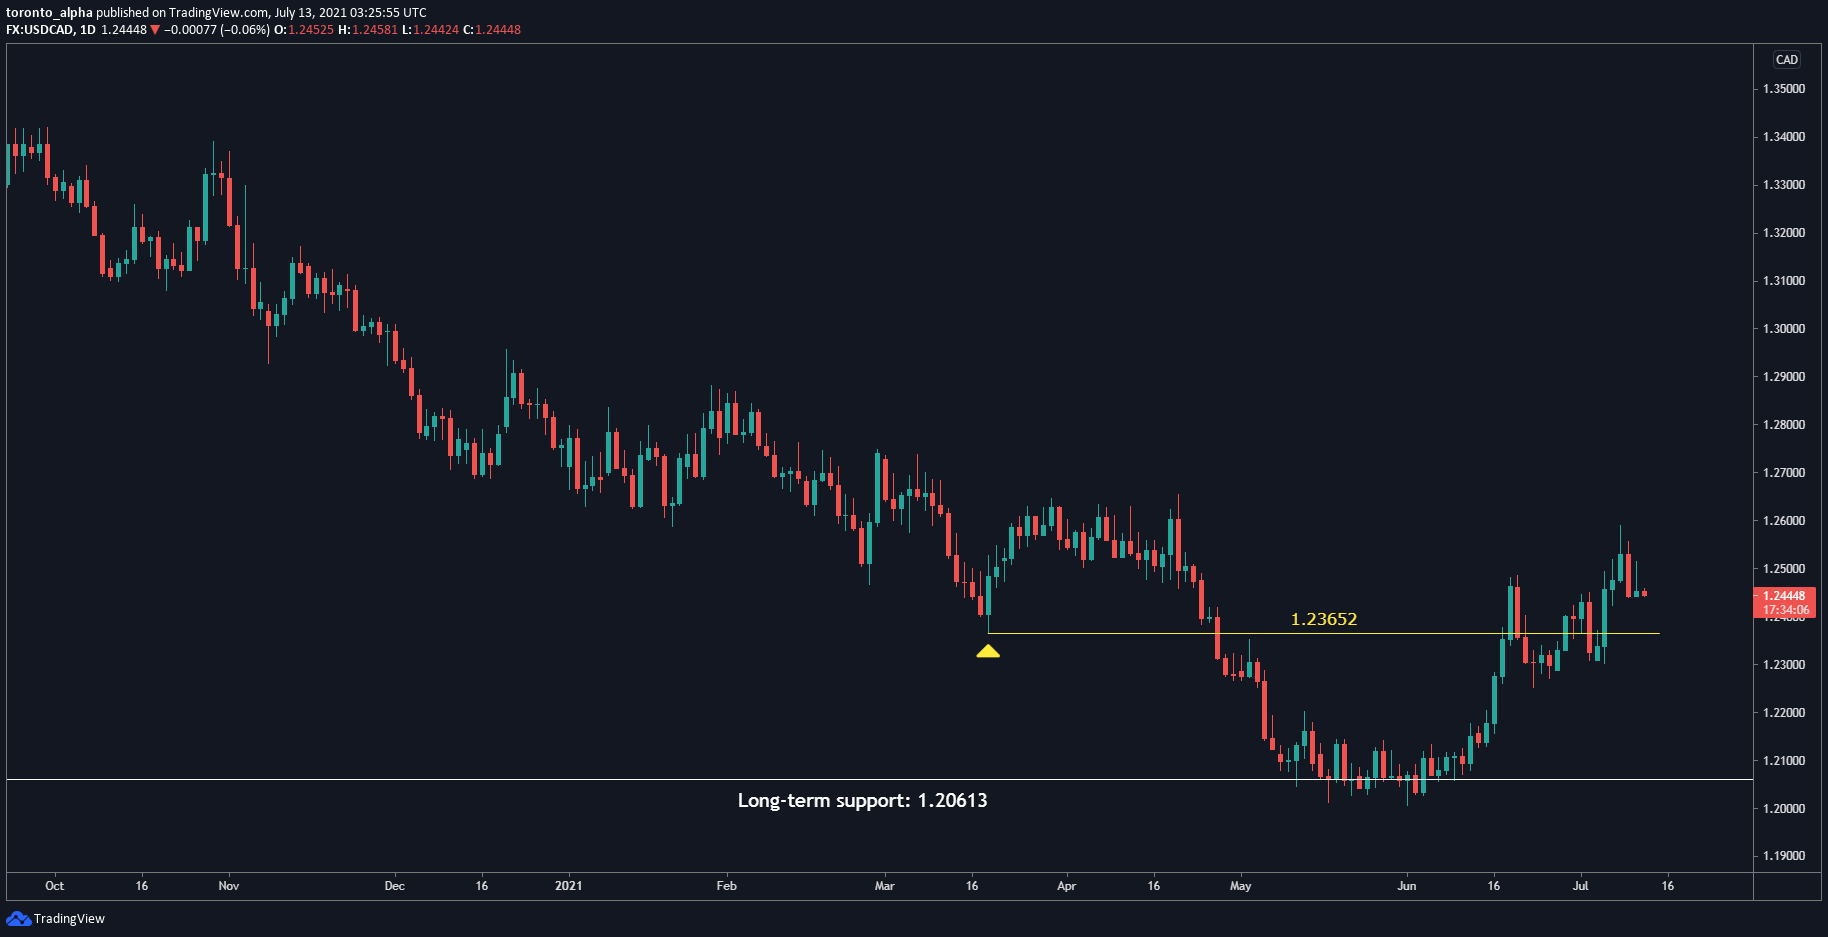
On the daily chart, the price has made a succession of higher-lows since June 2021, indicating an uptrend:
AUD/USD
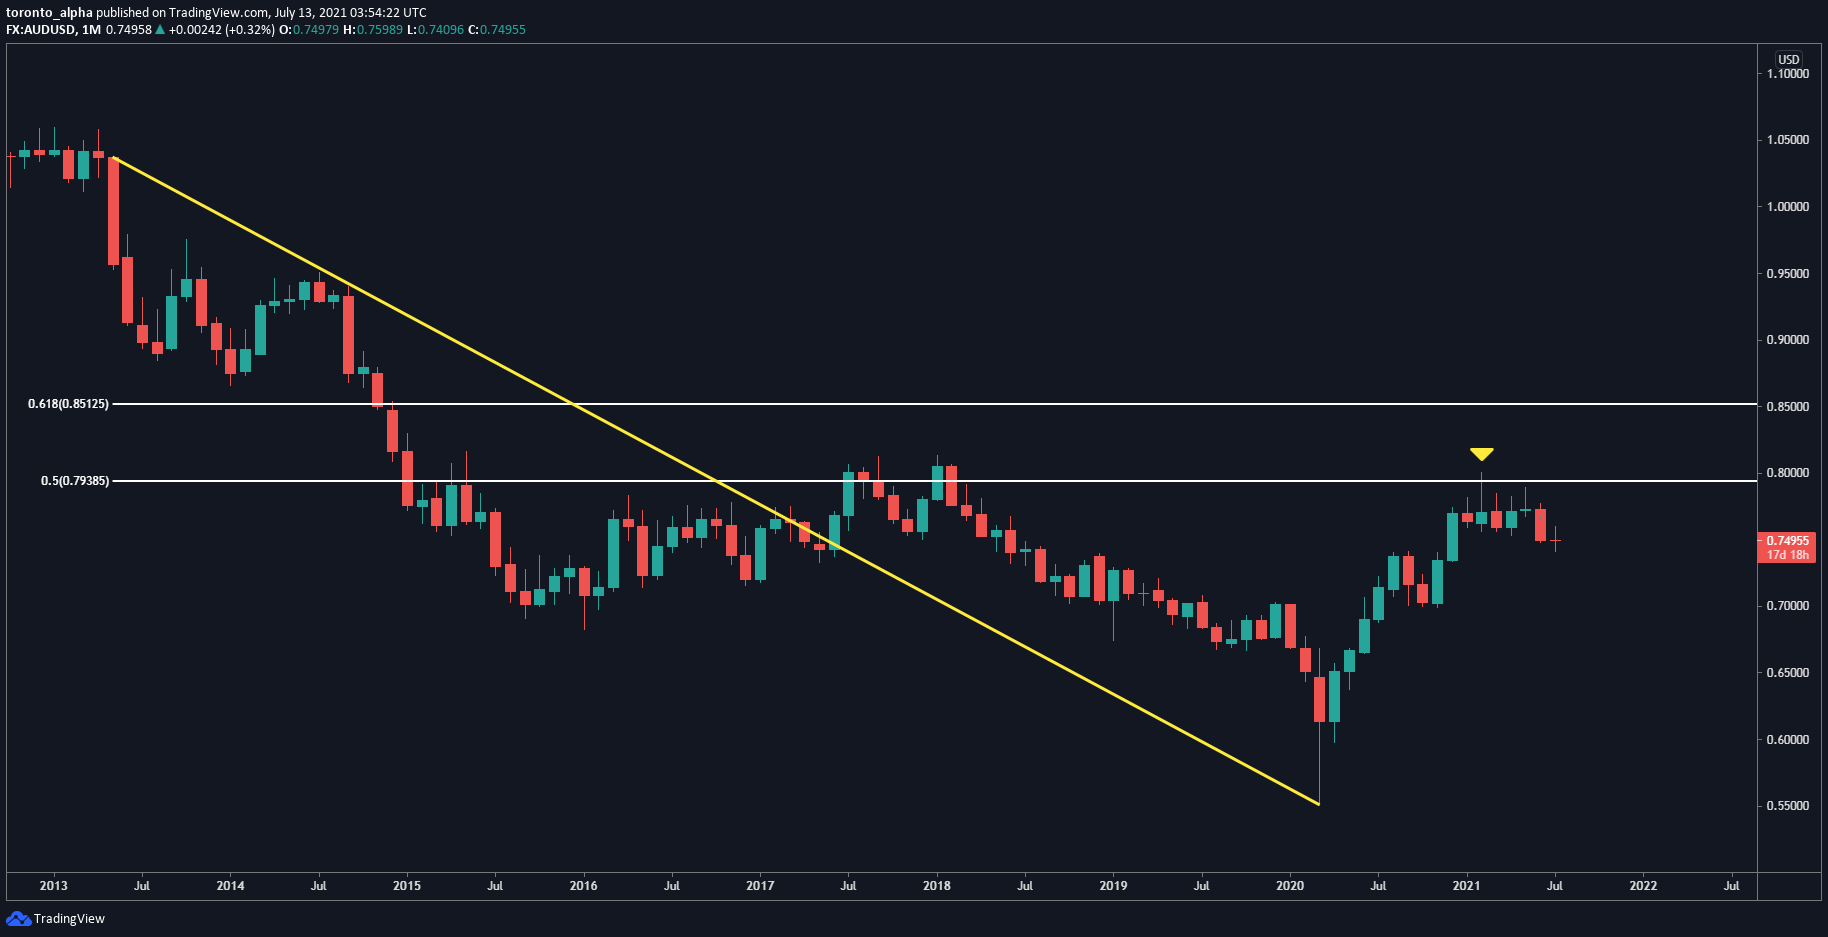
The AUD/USD came near a late-2017 resistance at 0.81358 and has coincided with a long-term 50% retracement level.
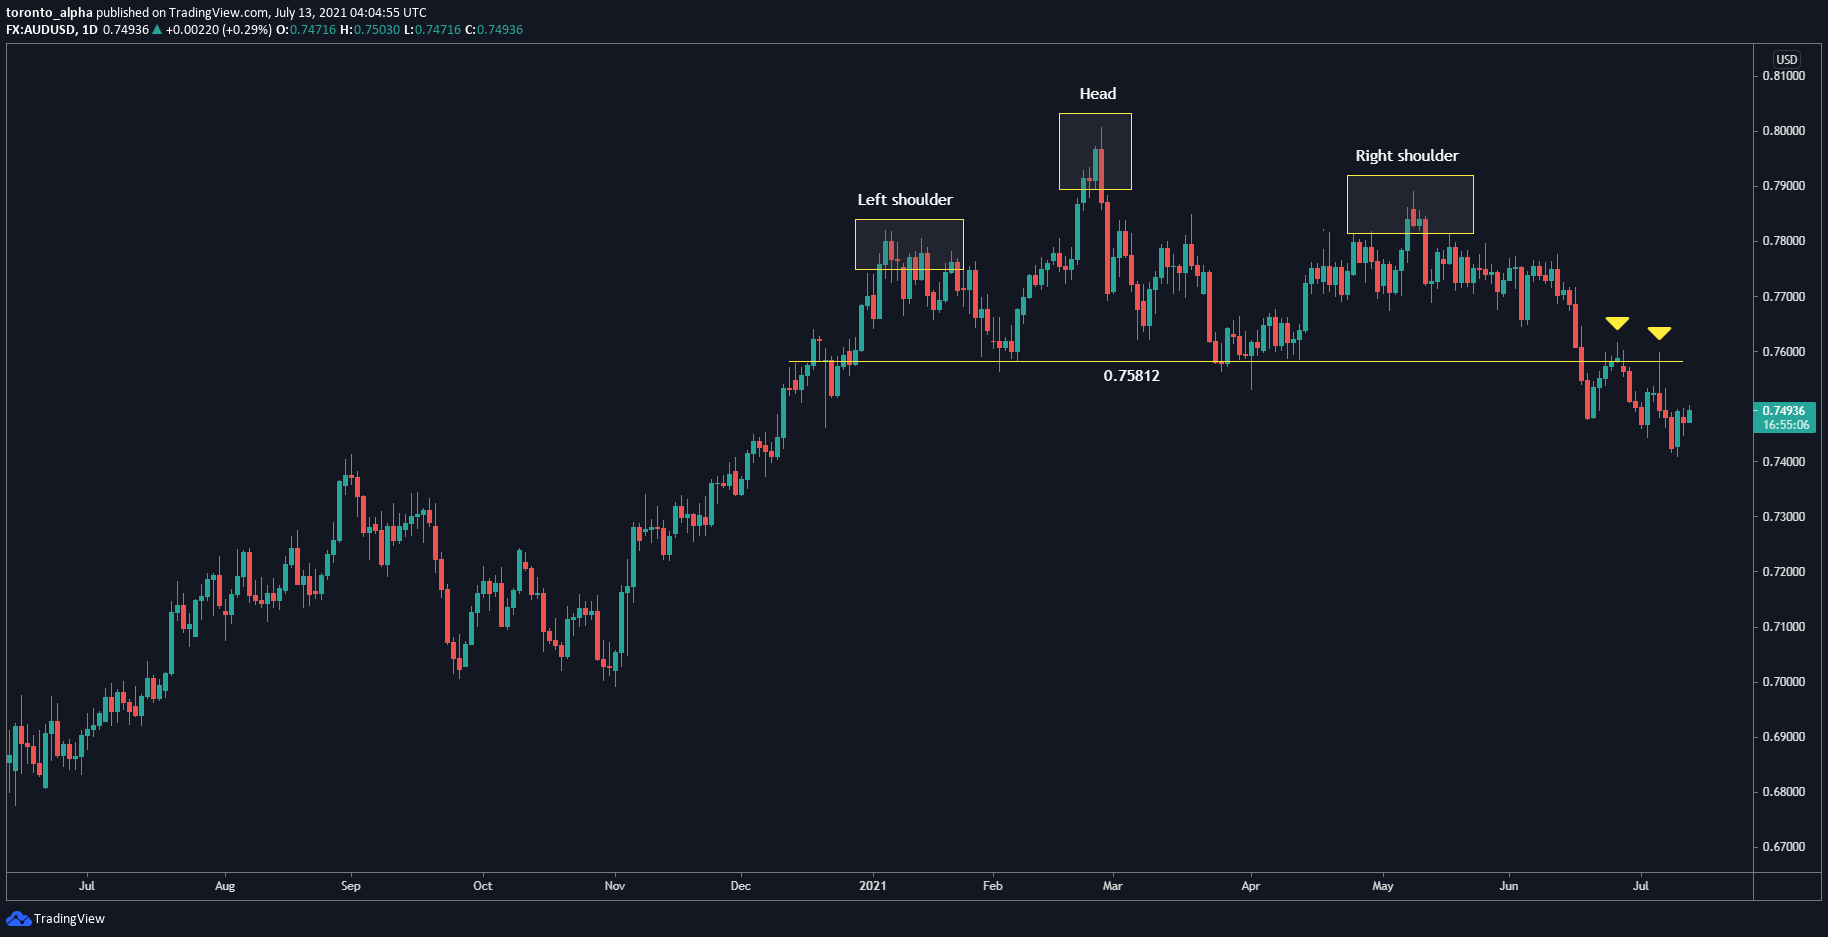
On the daily chart, the price made a head & shoulders reversal, and tested the neckline at 0.75812 as resistance, indicating a new downtrend is forming:
NZD/USD
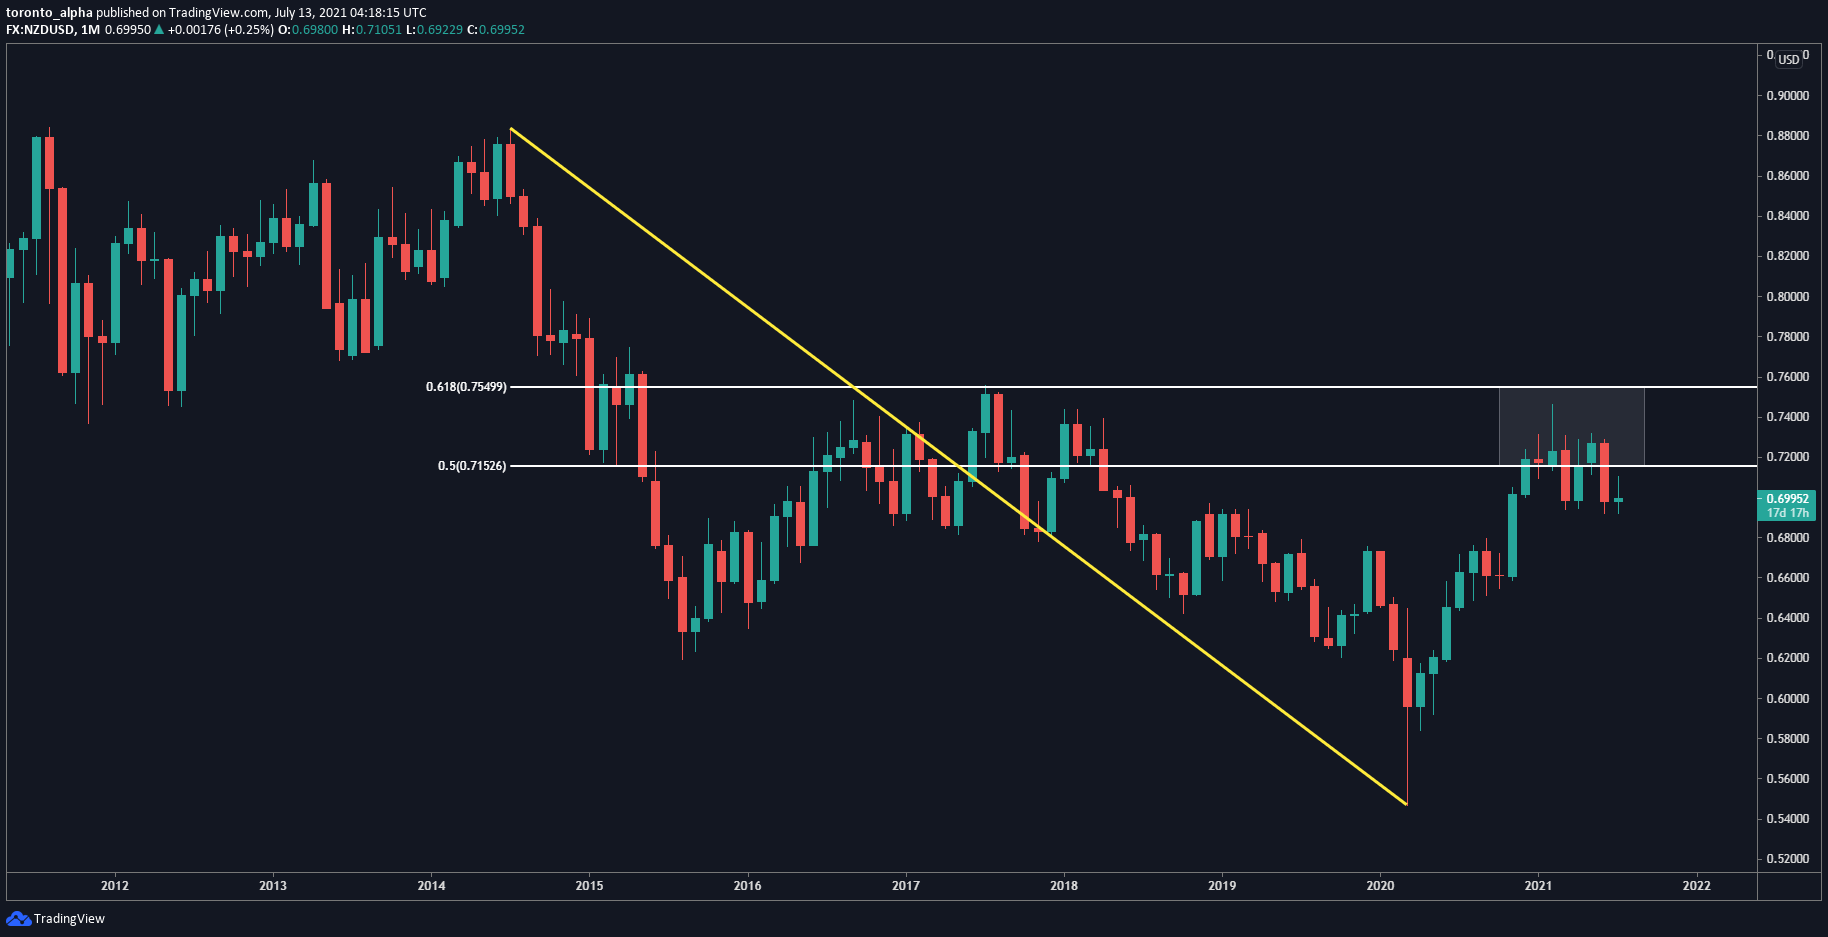
The NZD/USD came near an early-2017 resistance level at 0.75580, and the price bounced against a 50-61.8% retracement zone.
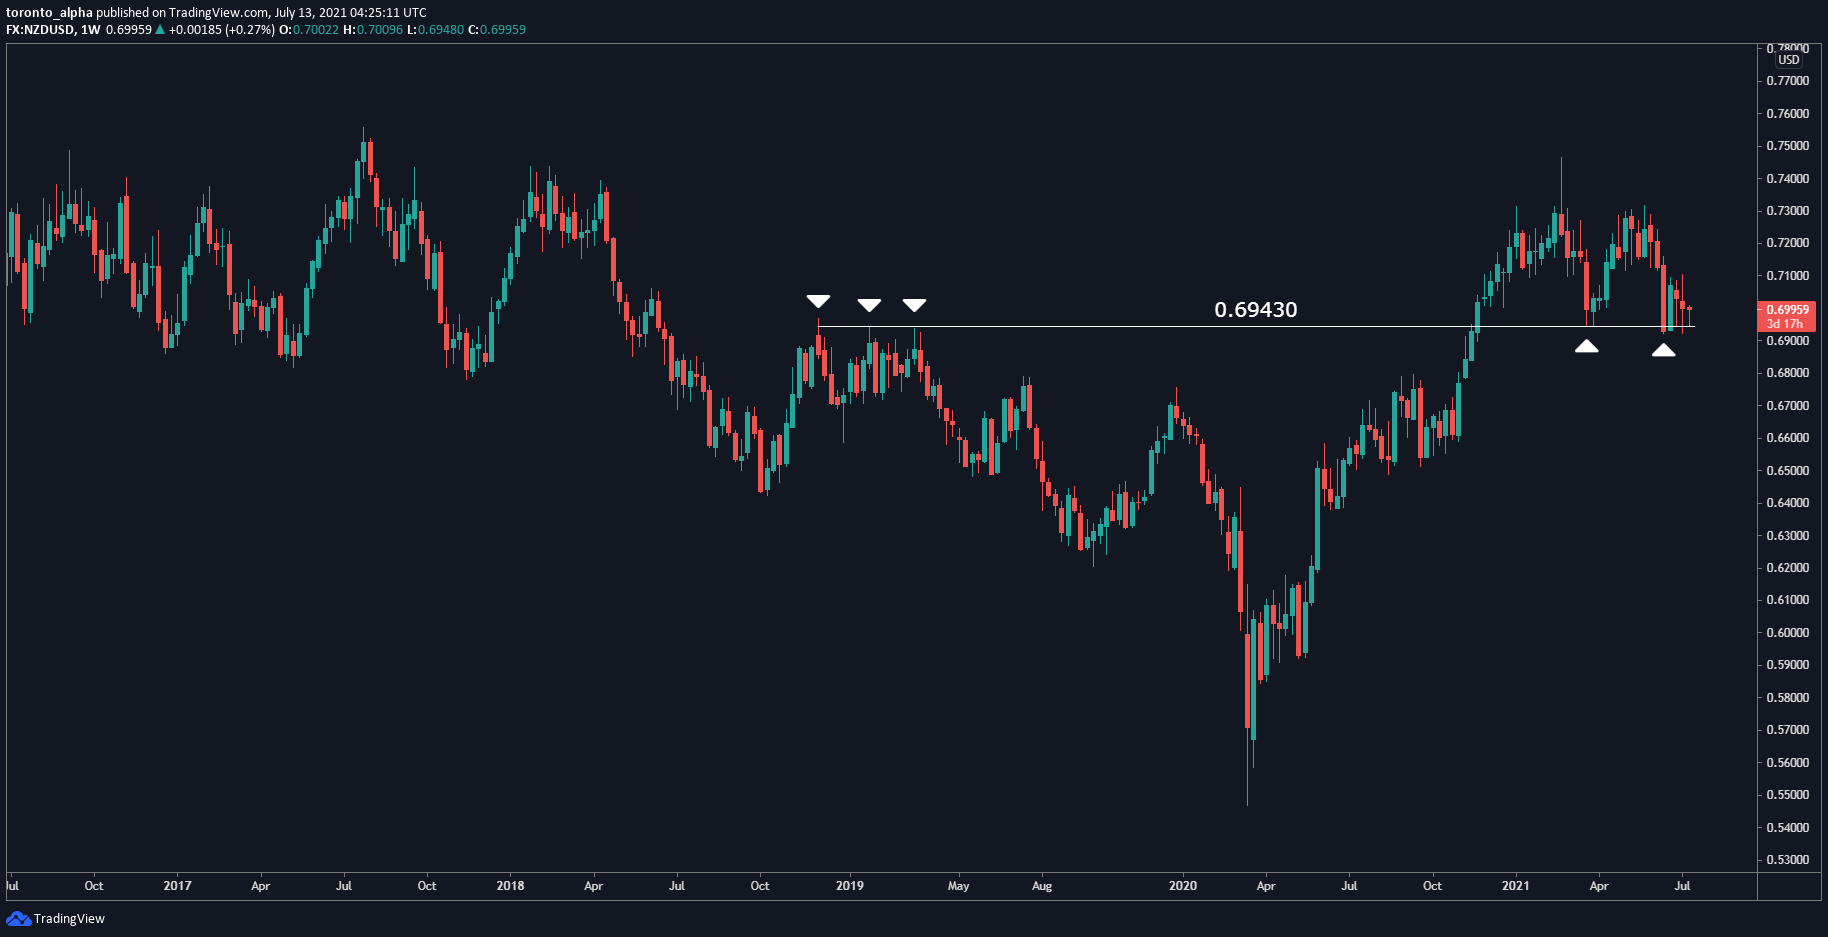
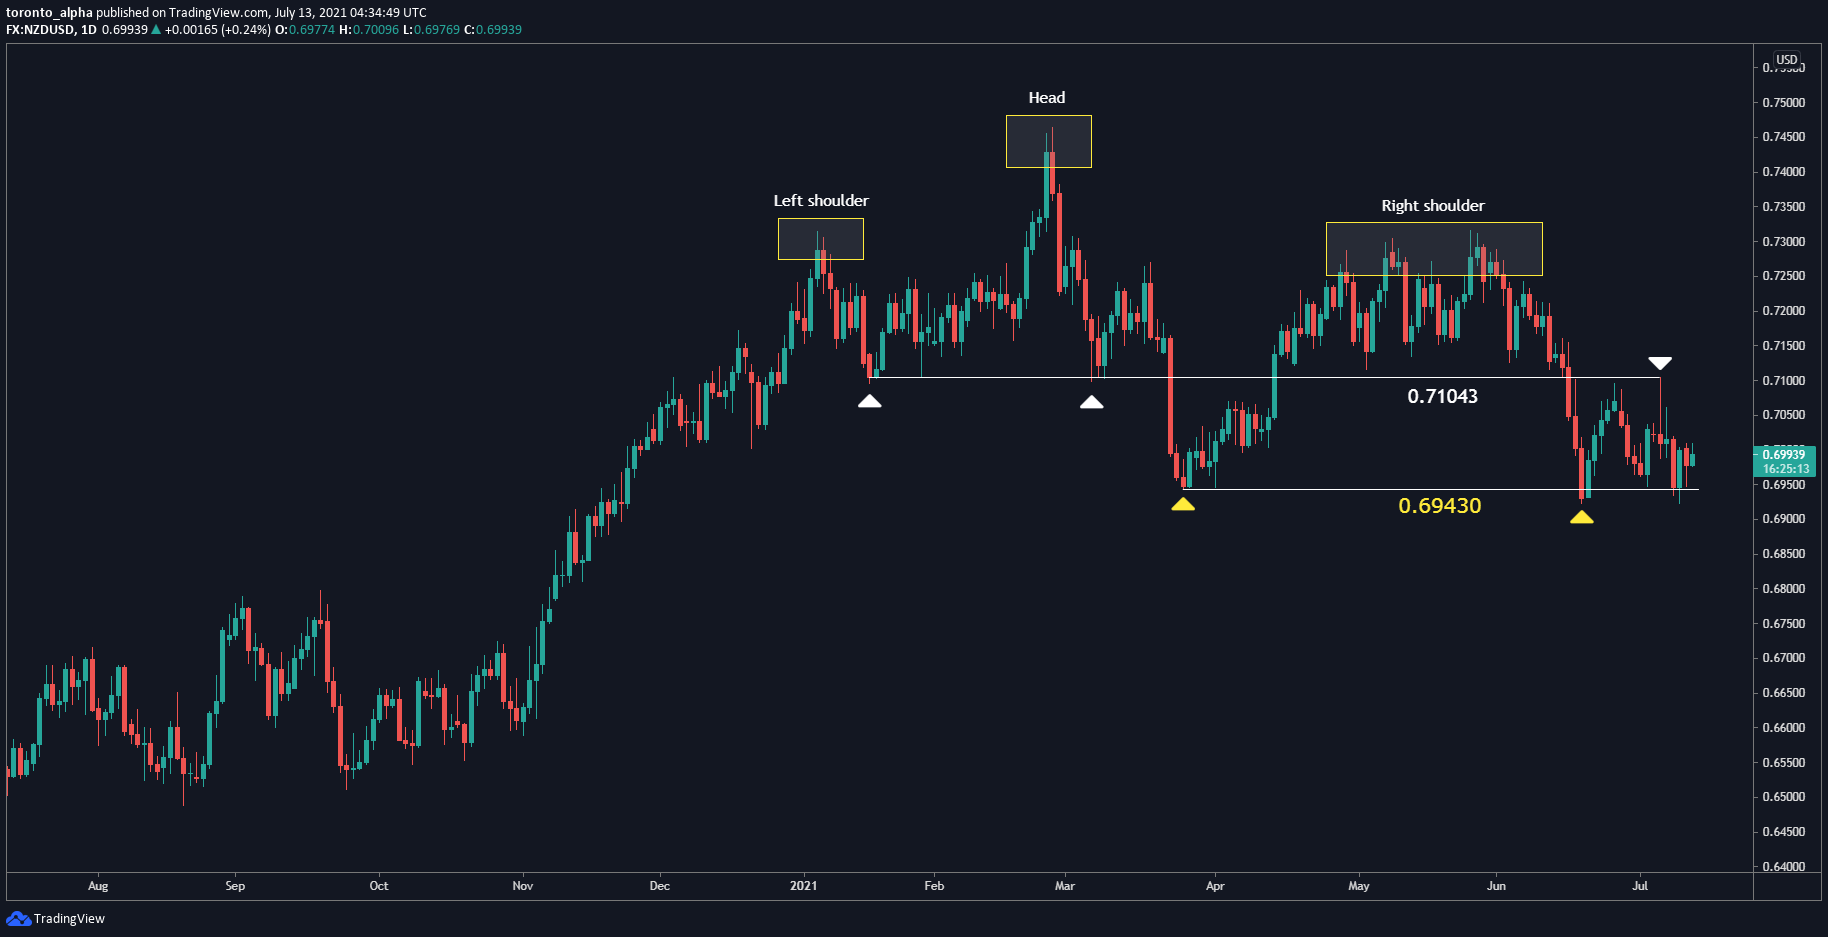
On the weekly chart, 0.69430 (a late 2018 / early 2019 resistance) is now a support level. The outlook is bearish, and the price must break 0.69430 to confirm this:
On the daily chart, a head & shoulders reversal is visible:
USD/JPY
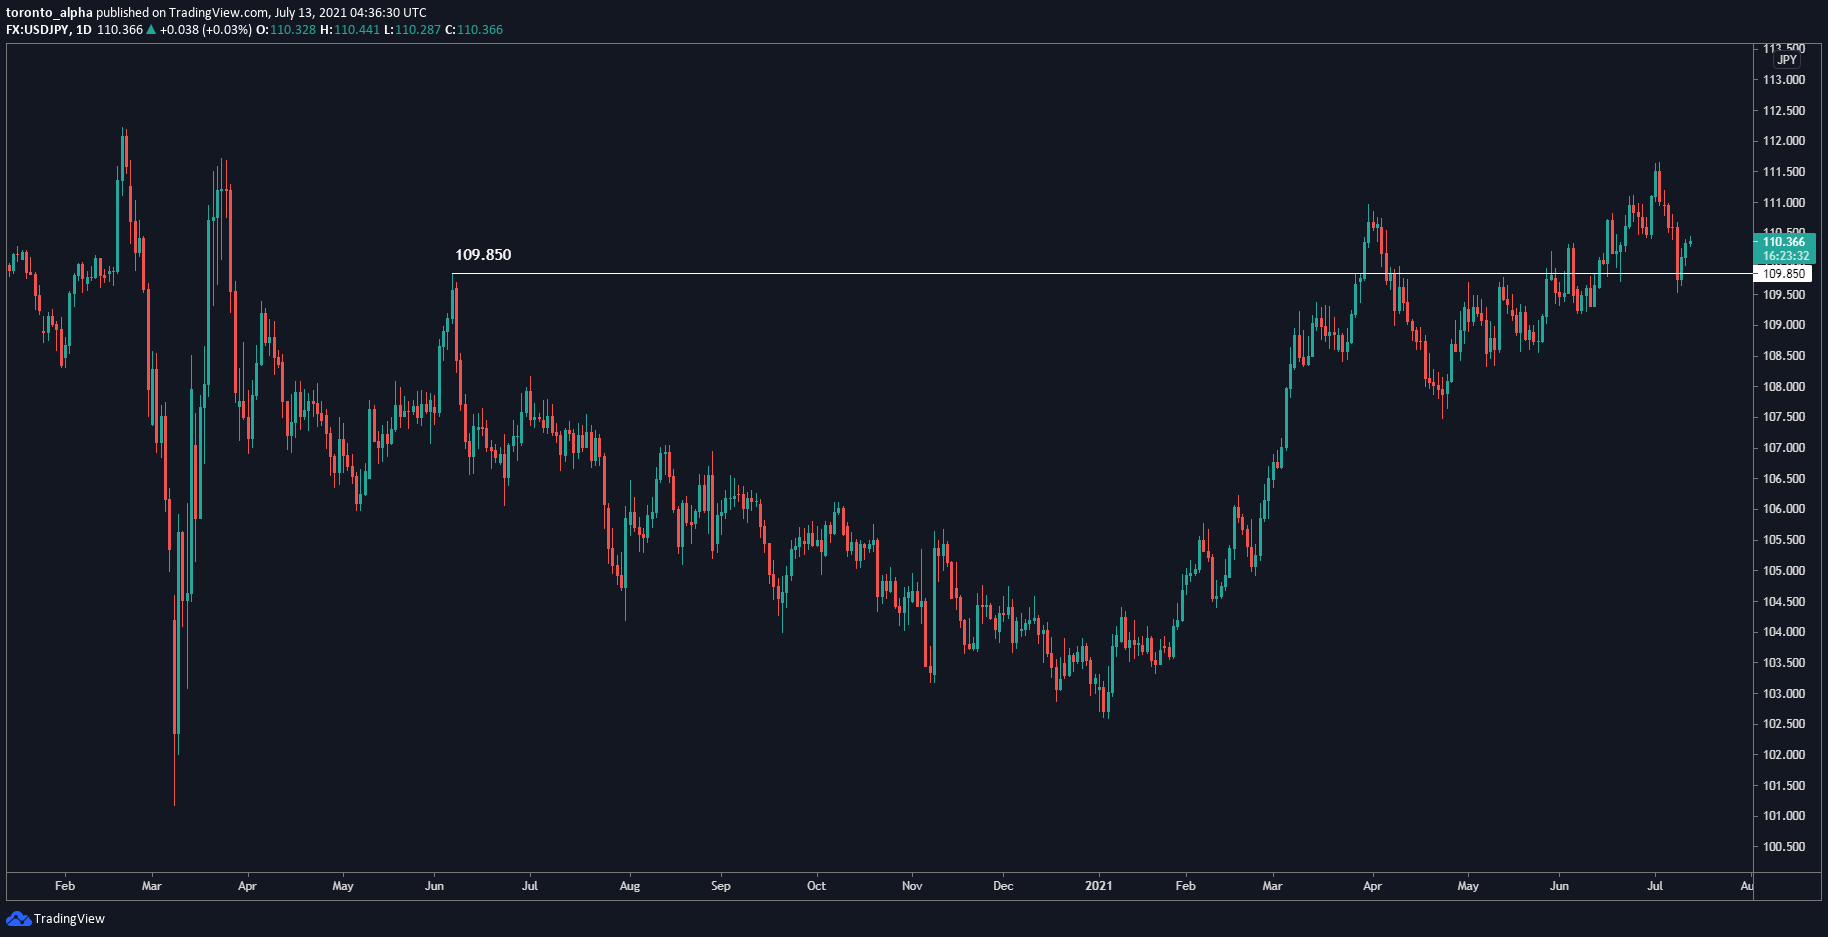 The USD/JPY has been in an uptrend since the beginning of 2021, reversing the downtrend of 2020. It has broken a key resistance at 109.850, further confirming the uptrend.
A word of caution about analyzing price charts: if a chart isn't clear to you, stay away. Either find a different chart or wait until it clears up, but the more guesswork involved, the more risk to your account.
Lastly, always mind your risk. Practicing risk management is essential to being a successful trader. Make sure to set good stop losses with good ratios when you trade.
