Top Forex Brokers
The difference between success and failure in Forex / CFD trading is highly likely to depend mostly upon which assets you choose to trade each week and in which direction, and not on the exact methods you might use to determine trade entries and exits.
So, when starting the week, it is a good idea to look at the big picture of what is developing in the market as a whole, and how such developments and affected by macro fundamentals, technical factors, and market sentiment.
Read on to get my weekly analysis below.
Fundamental Analysis & Market Sentiment
I wrote in my previous piece on 13th August that the best trade opportunities for the week were likely to be:
- Long of USD/JPY. The currency pair saw an increase of 0.31%.
- Long of Gasoline futures. The energy future declined, printing a price change of -11.83%.
Over the past week, market sentiment has begun to really improve, mostly due to a feeling that last Friday’s non-farm payrolls data came in lower than was expected earlier in the week, at a net increase of 187k, suggesting that the US economy is finally cooling off enough to remove any significant chance of the Fed making more rate hikes in the near term. This came on top of lower-than-expected US GDP data earlier in the week, at an annualized rate of only 2.1%, as was the low average hourly earnings increase of 0.2%, which is further evidence of cooling. The fact that we are now starting the month of September when major players might come back into the market in scale is also likely to be a factor working in the bulls’ favor.
Another factor helping the increasing risk-on sentiment is that US core PCE price index data did not exceed expectations, at a monthly increase of 0.2%.
Last week also saw the US Dollar continue to look strong, and several commodities rise, most notably WTI Crude Oil which has broken to a new multi-month high price.
Last week’s other key data releases were:
- US CB Consumer Confidence – this was below expectations, giving further evidence of economic cooling.
- US JOLTS Job Openings – this was below expectations, giving further evidence of economic cooling.
- US Unemployment Claims – met expectations.
- German Preliminary CPI (inflation) – met expectations.
- Australian CPI (inflation) – better than expected, with the annualized rate falling to 4.9% when 5.2% was expected.
- Swiss CPI (inflation) – met expectations.
The Week Ahead: 4th September – 8th September
The coming week in the markets is likely to see a considerably higher level of volatility than last week, as we will see the end of the summer season and a return to a market with higher volumes. This week’s key data releases are, in order of importance:
- Bank of Canada Overnight Rate and Rate Statement
- RBA Cash Rate & Rate Statement
- Australian GDP
- US Unemployment Claims
- US ISM Services PMI
- Canadian Unemployment Rate
- Chinese CPI (inflation)
It will be a public holiday in the USA and Canada on Monday.
Technical Analysis
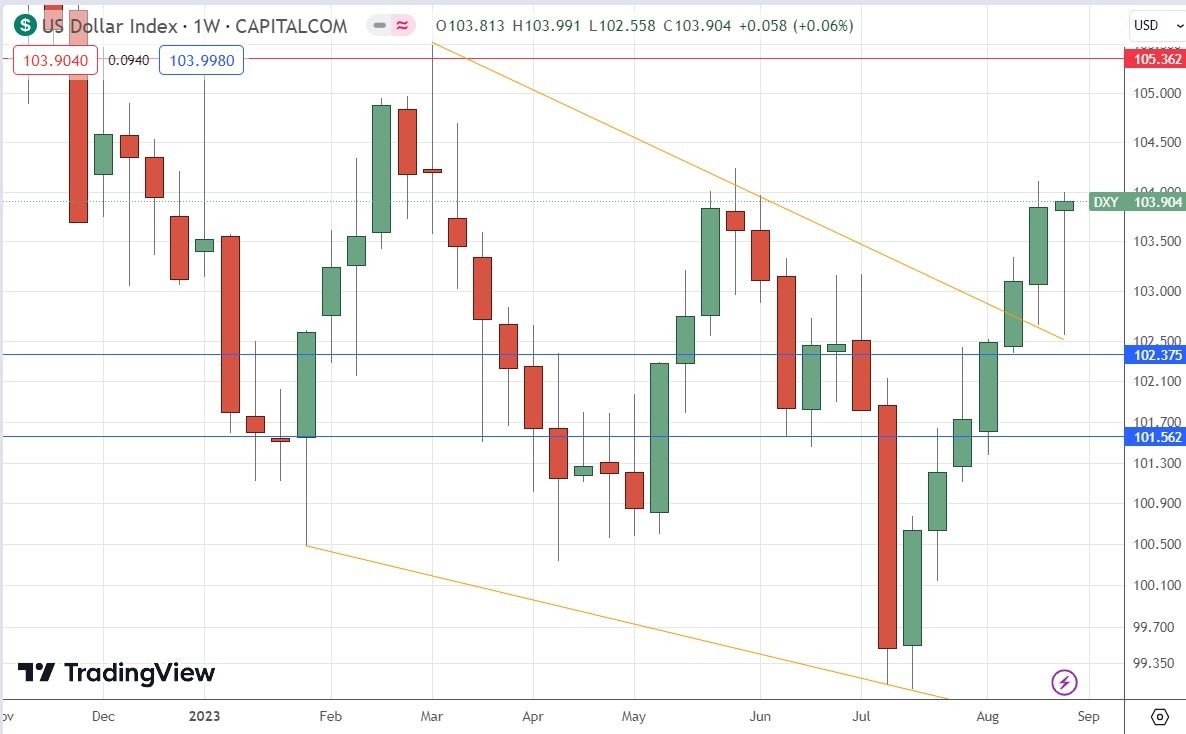
US Dollar Index
The daily price chart below shows the U.S. Dollar Index advanced strongly last week to close at a near 6-month high price, continuing its bullish trend. A few weeks ago, it made a bullish breakout beyond the upper trend line of a long-term descending wedge pattern, as I had forecasted.
The price ended the week near the high of its range, printing a bullish pin bar. These are additional bullish signs.
Although the Dollar seems to be in a long-term bullish trend evidenced by the price trading above its level from 3 months ago, it is still slightly below its level of 6 months ago.
I see the US Dollar as having bullish momentum, which means it is probably a good idea to only look for long trades in the US Dollar this week.
EUR/USD
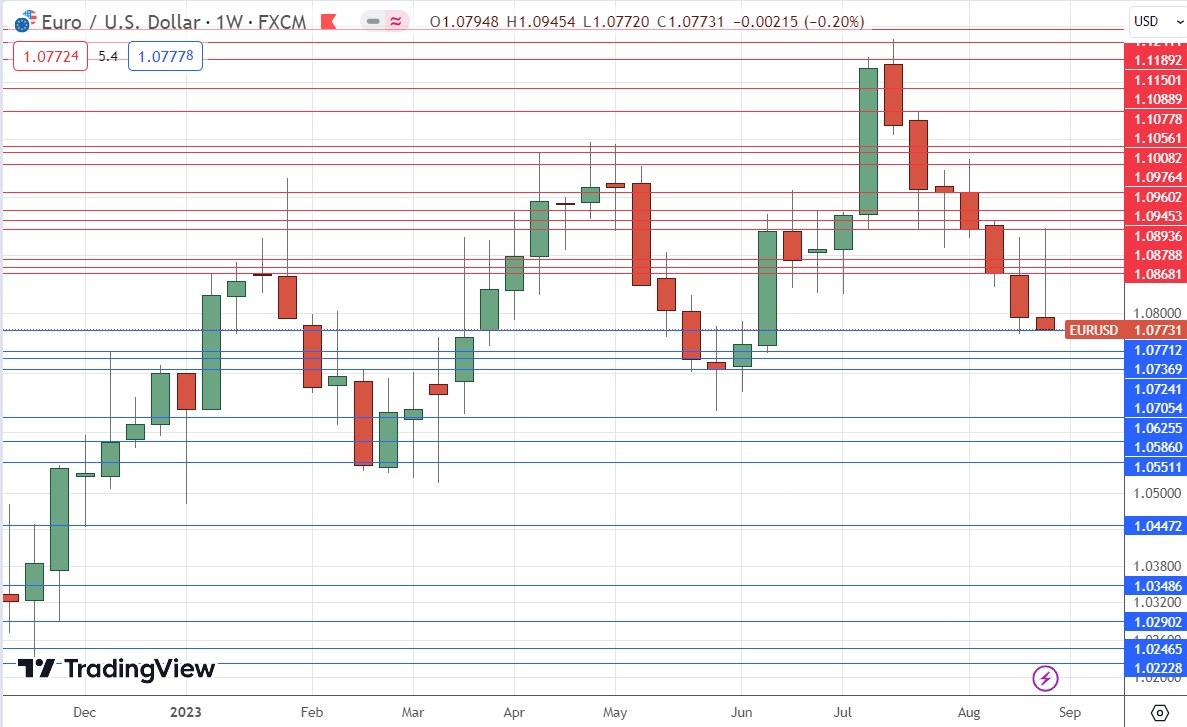
The EUR/USD currency pair printed a bearish pin bar, which closed right on its low, making the lowest weekly close in 12 weeks.
This currency pair will be getting some attention right now as it is showing medium-term bearish momentum which is threatening to become long term. This would likely be triggered by a bearish breakdown below the support levels which are clustered between the weekly close and the round number at $1.0700.
This pair may be a good candidate to day trade short if it is retracing to resistance, but longer-term traders should wait for sub-$1.0700. There may be long trades available from failed tests of $1.0700 also.
USD/JPY
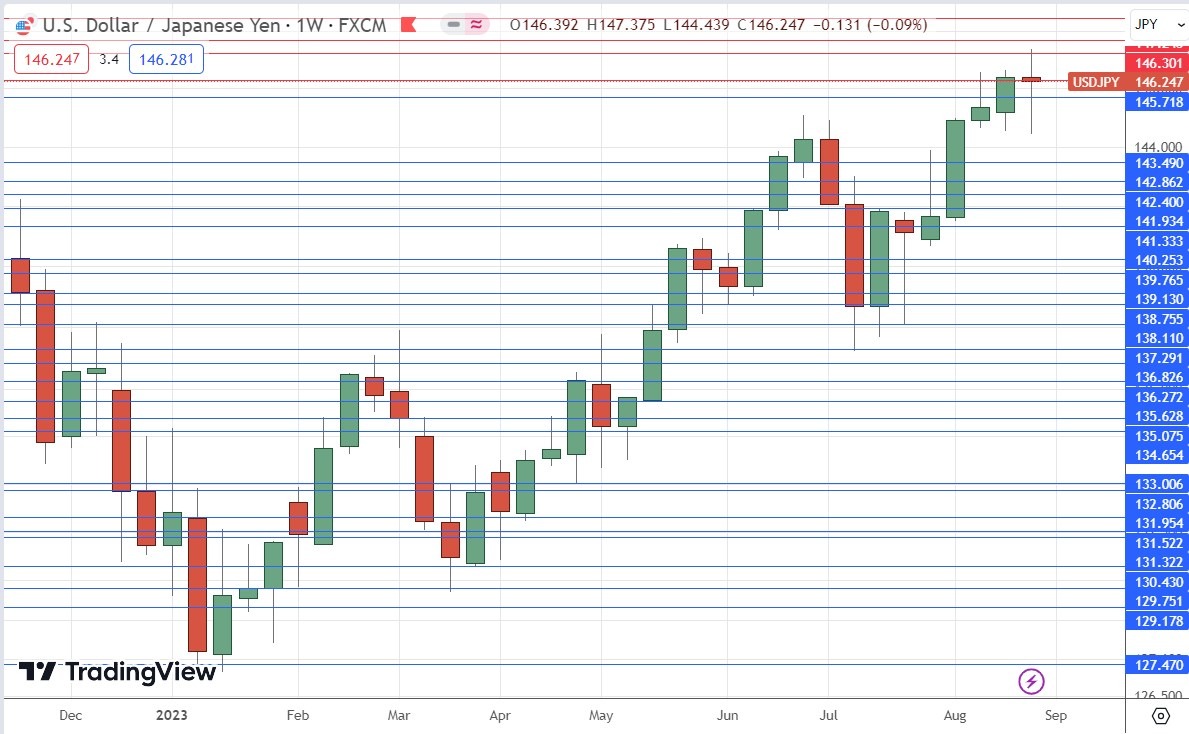
The USD/JPY currency pair printed a candlestick which was something between a bullish pin bar and a bearish doji, showing that the long-term bullish trend which has been running since the start of 2023 has slowed in momentum.
Despite the pause, the price action is still quite bullish, with the price having retraced little from recent long-term highs.
I still that this currency pair as a long-term buy due to the very loose monetary policy of the Bank of Japan, as well the long-term downwards trend in the Yen. Cautious traders might want to wait for a daily close above 147.25 before entering a new long trade.
WTI Crude Oil
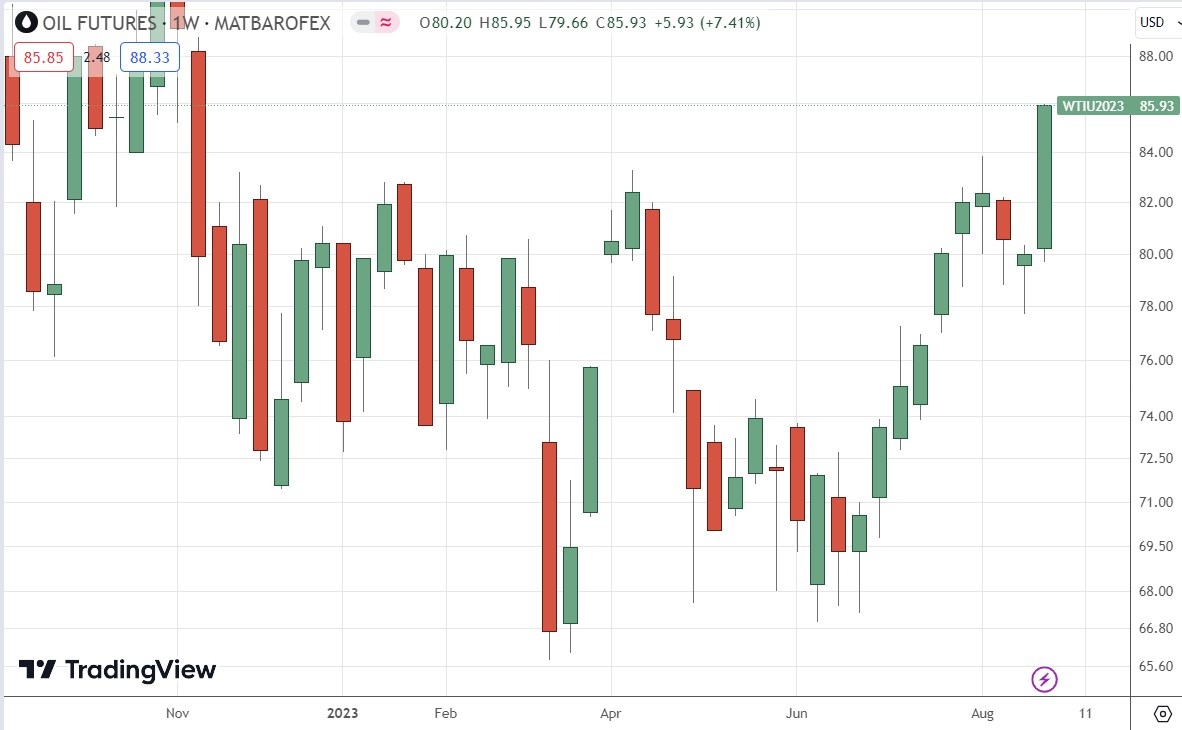
The current WTI Crude Oil future made a strong bullish move over the past week, closing at its highest weekly close in 9 months. This is a clear volatility breakout from a dominant price range and the close was right on the high of the week’s range. These are bullish signs.
The growing optimism that the Fed is done with rate cuts has pushed up risky assets and increased hopes for more factory orders for crude oil.
Trend trading commodities long when they make bullish breakouts to new long-term high prices has historically been a very profitable trading strategy.
I see WTI Crude Oil as a buy.
NASDAQ 100 Index
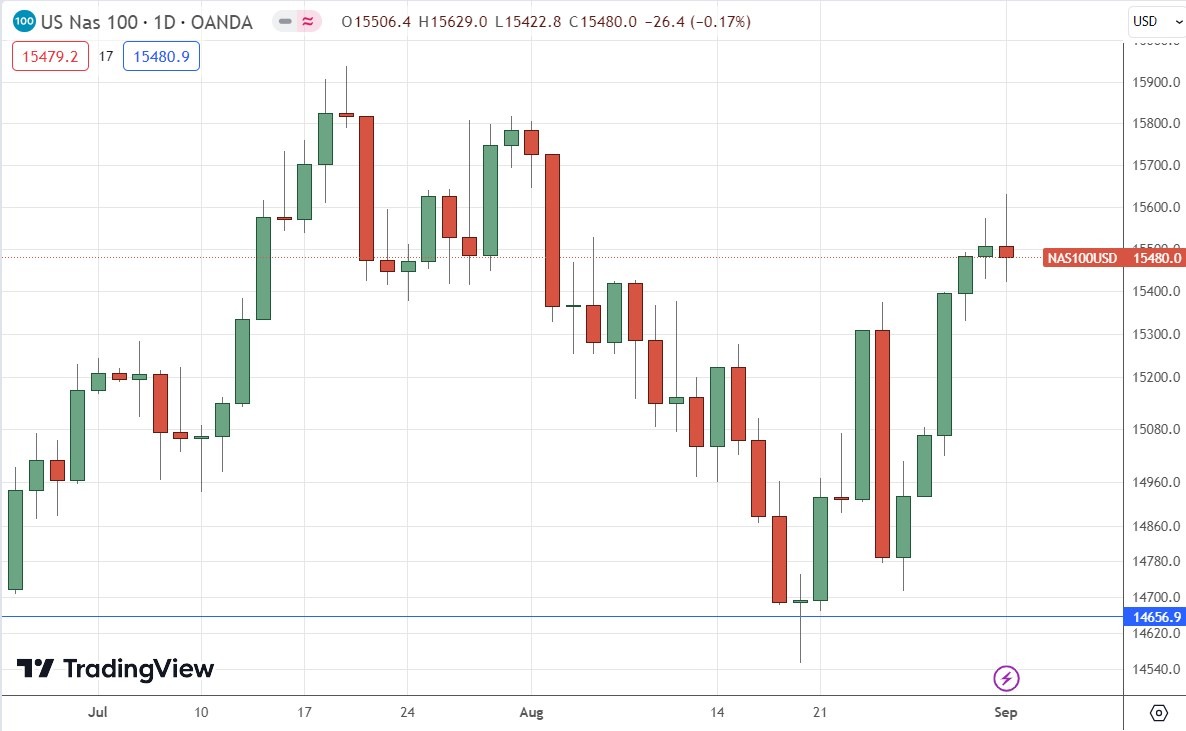
Last week saw a firm rise in the price of the NASDAQ 100 Index after it was held during the previous week by the support level at 14657. However, despite the increasing feeling that the terminal rate has been reached following Friday’s non-farm payrolls data release showing the US economy finally starting to significantly cool off, the last day of the week produced a bearish pin bar, suggesting that we may now be due a retracement.
The US stock market, and especially the tech sector, is certainly in a bullish market, but the recent long-term highs are still some distance away.
I think that the best approach for anyone looking to enter a new long trade is to wait for a bearish retracement which lasts at least 3 or 4 days before waiting for the price to rise again and break out of its recent range to the upside.
Bottom Line
I see the best trading opportunities this week as long of USD/JPY and of WTI Crude Oil.
Ready to trade our Forex weekly forecast? Here’s a list of some of the best Forex trading platforms to check out.
