The difference between success and failure in Forex / CFD trading is very likely to depend mostly upon which assets you choose to trade each week and in which direction, and not on the exact methods you might use to determine trade entries and exits.
So, when starting the week, it is a good idea to look at the big picture of what is developing in the market as a whole, and how such developments and affected by macro fundamentals, technical factors, and market sentiment. Read on to get my weekly analysis below.
Fundamental Analysis & Market Sentiment
I wrote in my previous piece last week that the best trades for the week were likely to be:
- Long of USD/JPY following a daily (New York) close above €135.47.
- Short of BTC/USD. This trade produced a loss of 4.16%.
- Short of ETH/USD. This trade produced a loss of 9.75%.
The crypto losses are far less than the huge wins made in crypto trades during the previous week.
The news is currently dominated by political items that do not have major economic impact. After more than four months, the war in Ukraine has faded away from its former place as a lead news item and appears to be having little effect on markets except possible weighing on global recession fears. There are fears concerning a potential blockade regarding agricultural commodities such as Wheat and Corn, but their prices are generally trading lower now.
Last week was dominated by a small rebound in risk appetite. It is noteworthy that “fear” indicators such as the VIX are showing much lower levels than were seen in previous bear markets. The US stock market is still in a bear market.
The past week has seen all the strong trends come off their highs and lows, with overall directional movement notably lower. As the end of the month approaches in just a few days, following a very active spring season in the markets this year, it may be that we are about to get into a summer lull of dull markets with no breakouts. This often happens during the months of July and August, hence the adage “sell in May and go away.”
Last week’s important economic data releases came in as follows:
Chair of the US Federal Reserve Testified Before Congress. He said that recession was a possible outcome of the course of rate hikes, but this had little lasting effect.
British CPI – an annualized rate of 9.1% was expected and reached. Cope CPI was a little lower than expected. Overall, this had little impact.
Canadian CPI – a month on month increase of 1.4% was reported compared to the expected 1.0%.
Reserve Bank of Australia Monetary Policy Meeting Minutes. Inflation expected to increase, rate hikes less than 0.25% per meeting over coming months also expected.
German Flash Manufacturing & Services PMI. This came in slightly lower than expected.
Canadian Retail Sales. This came in much stronger than expected. Taken with the high and increasing rate of inflation, this suggests that the Canadian economy is still overheating despite recent rate hikes.
The Forex market saw a minor selloff in the US Dollar last week while the Japanese Yen, whose weakness is still tacitly encouraged by the Bank of Japan, also looks weak. The Euro is the strongest major currency.
Rates of coronavirus infection globally again rose last week against the long-term downwards trend, suggesting that we may be seeing the start of a new major wave, possibly driven by the new omicron BA5 subvariant. The significant growths in new confirmed coronavirus cases overall right now are happening in Austria, France, Israel, Bahrain, Cyprus, Germany, Greece, Guatemala, Italy, Lithuania, Malta, Mexico, Morocco, Singapore, and the UAE.
The Week Ahead: 27th June – 31st June 2022
The coming week in the markets is likely to be much less volatile than last week. There are very few releases of high importance scheduled which have the potential to significantly move markets. They are, in order of likely importance:
US Core PCE Price Index data – this might give some clues about inflation.
US CB Consumer Confidence data
US ISM Manufacturing PMI data
It is a public holiday in Canada on Friday 31st June.
Technical Analysis
U.S. Dollar Index
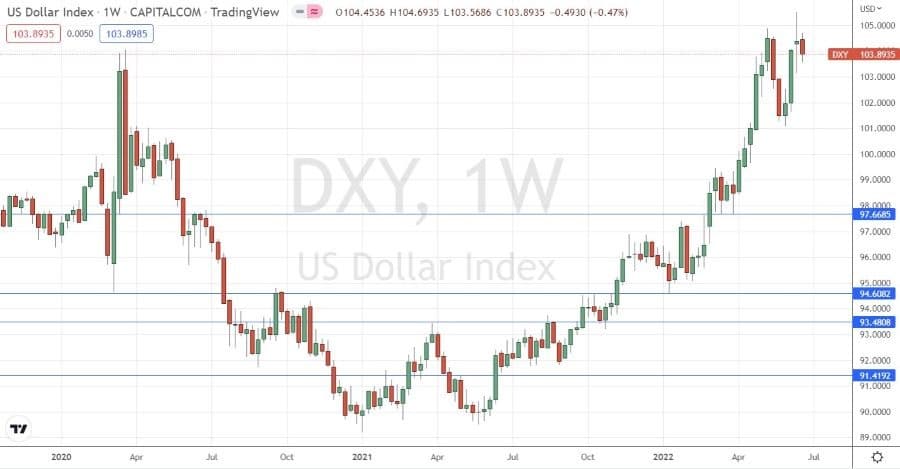
The weekly price chart below shows the U.S. Dollar Index printed a bearish inside bar after falling from a 20-year high the previous week, against the long-term bullish trend. This is significant as a trend reversal in the US Dollar would have a major impact on the Forex market.
It is worth noting that the US Dollar’s long-term bullish trend has been boosted, so far, by rising inflation and interest rates. However, as the US economy comes closer to a statistical recession, the more the US Dollar may become subject to bearish pressures.
It is probably a good idea not to trade the US Dollar long over the coming week unless it makes a strong upwards movement for a day or so.

US Dollar Index Weekly Chart
BTC/USD
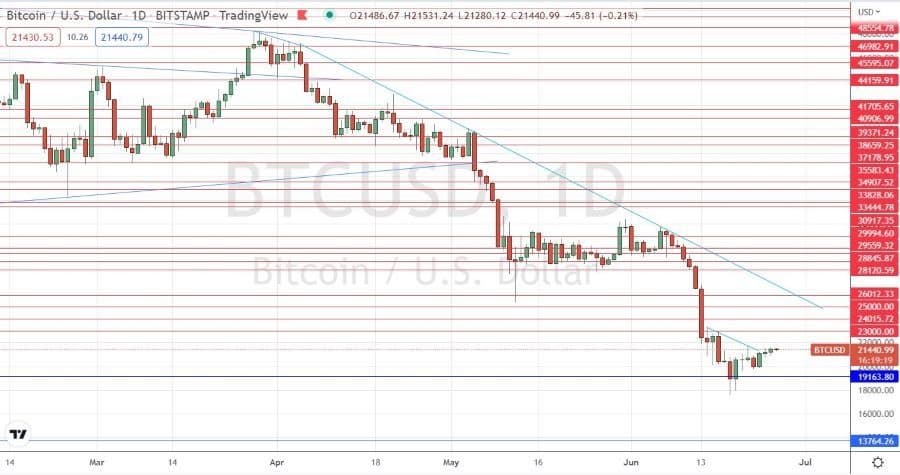
Bitcoin rose last week after falling very strongly the previous week in line with its long-term bearish trend. The week ended with a bullish inside bar which is trading near its high, suggesting that this bullish retracement might last for a while.
Despite the minor bullish signs, there has been very strong selling and I think it is unwise to go long of Bitcoin this week.
It looks as if Bitcoin is still likely to fall further eventually. The price could easily reach the $13k area technically, meaning a short here could still be an interesting trade.
I would be prepared to enter a short trade if we get a daily (New York) close below $18,500 during this week.
The price chart below shows that $13,788 looks like the technical support level which might signify a full bursting of the Bitcoin bubble.

BTC/USD Daily Chart
ETH/USD
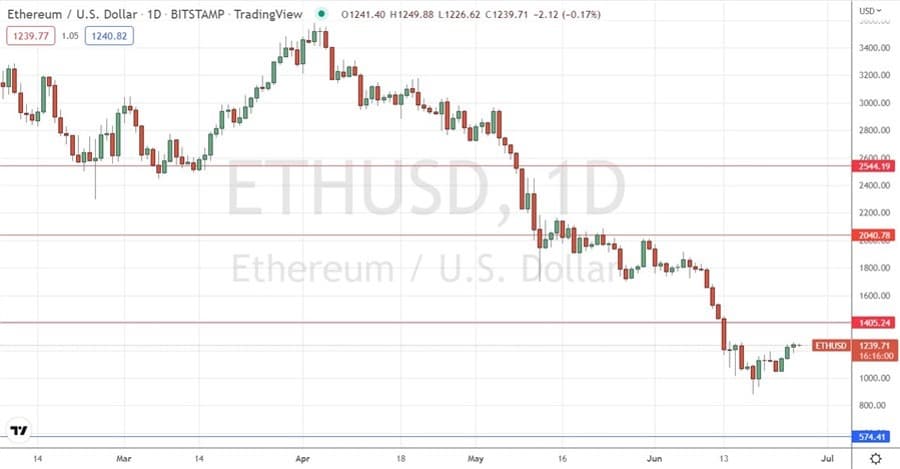
Bitcoin rose quite firmly last week – more so than did Bitcoin - after falling very strongly the previous week in line with its long-term bearish trend. The week ended with a bullish inside bar which is trading near its high, suggesting that this bullish retracement might last for a while
Despite the minor bullish signs, there has been very strong selling and I think it is unwise to go long of Ethereum this week.
It looks as if Ethereum is still likely to fall further eventually. The price could easily reach the $571 area technically, meaning a short here could still be an interesting trade.
I would be prepared to enter a short trade if we get a daily (New York) close below $993 during this week.
The price chart below shows that $571 looks like the technical support level which might signify a full bursting of the crypto bubble.

ETH/USD Daily Chart
USD/JPY
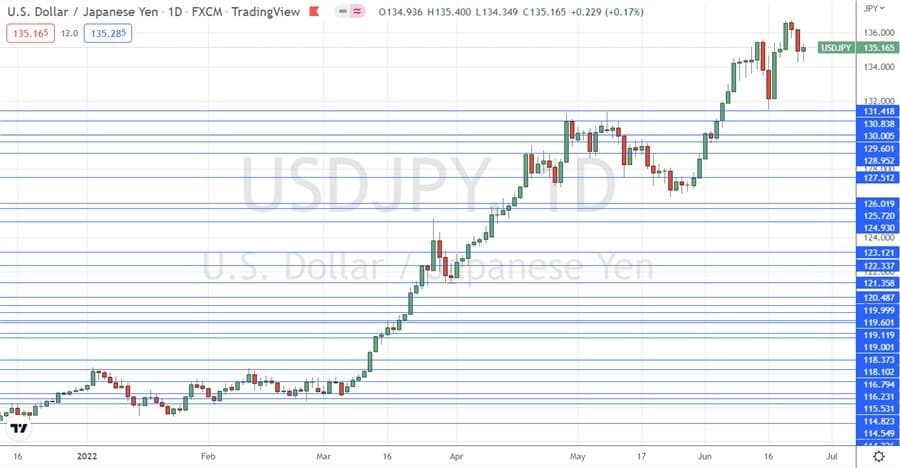
After initially powering up to yet another 20-year high, the USD/JPY currency pair dropped quite sharply before recovering a little later in the week, to produce a small net weekly gain.
The US Dollar seems to have lost its strength and its long-term bullish trend may have already peaked two weeks ago, although it is too early to say this with any confidence. However, the Japanese Yen remains relatively weak and is being talked down by its central bank, the Bank of Japan, which desperately needs to reflate the Japanese economy, whose inflation remains below the target of 2%.
It is of course unclear how much further the move might run, or whether it will even happen at all. The best sign to look for will be whether this currency pair manages to close in New York at another new 20-year high closing price. USD/JPY remains a buy if we see a daily (New York) close above €136.59.

USD/JPY Daily Chart
Bottom Line
I see the best opportunities in the financial markets this week as likely to be:
- Long of USD/JPY following a daily (New York) close above €135.47.
- Short of BTC/USD following a daily (New York) close below $18,500.
- Short of ETH/USD following a daily (New York) close below $993.
