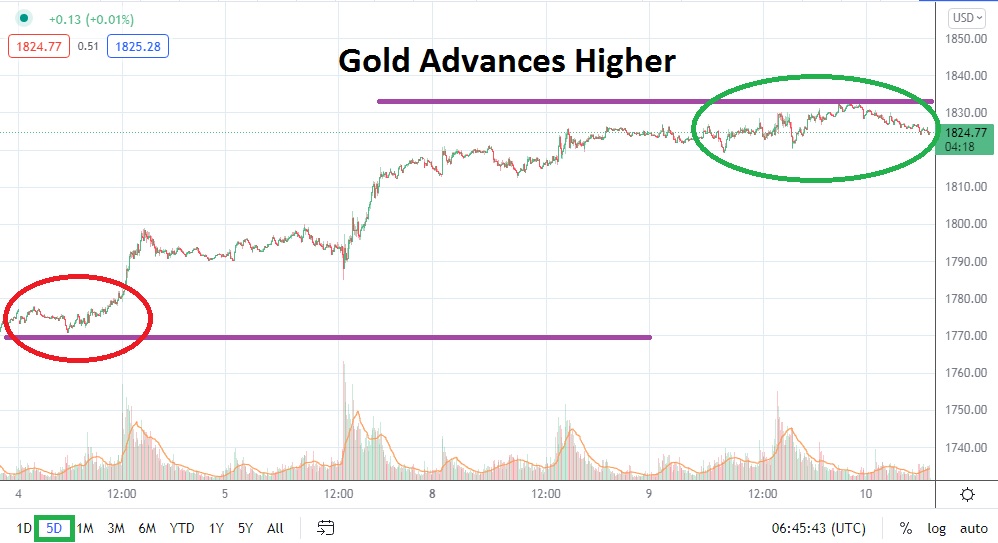
Gold has seen a swift advance higher take place the past handful of days. On November the 4th gold was trading near the 1770.00 value which has acted as a rather solid support level since the end of the third week in October. However, the precious metal has made a strong and consistent climb upwards since touching this support and gold now finds itself actually testing crucial mid-term resistance.
As if this writing, the price of gold is near the 1825.00 mark and conditions can be considered fast because of the amount of velocity the commodity has expressed the past couple of days. The 1830.00 ratio as resistance sticks out like a sore thumb, and speculators who look at six-month charts will clearly see that this value has been a strong roadblock consistently in July, August and September when tested.
The ability of gold to trade above the 1830.00 level in a sustained manner has not taken place since May and June. Before that timetable, the months of December 2020 until the second week of February 2021 did see gold trade above the 1830.00 level with relative ease too. For speculators with their eyes on a lofty profit the price of gold reached a height of nearly 1960.00 on the 6th of January 2021.
However, before traders who have bullish sentiment get overly ambitious, they should wait for realistic resistance levels to actually be broken. The 1830.00 mark will need to be penetrated and price action will have to test other mid-term highs near 1844.00 before more confidence is generated that a real bullish cycle will develop. On top of that the 1860.00 level would need to be toppled for price action to get the attention of those who still have doubts about the precious metal’s ability to create a dynamic move higher.
Traders who believe gold has gained too fast and want to sell near these important resistance levels may find that they are playing with fire, but they have justifiable cause. Sellers should use stop loss orders that are a touch above the 1830.00 juncture if they are looking for downside action and targeting nearby support levels with take profit positions. The trend in gold has been solid the past week, but for higher price momentum to be attained, the 1830.00 level needs to be brushed aside and the 1840.00 mark has to prove vulnerable.
Gold Short-Term Outlook
Current Resistance: 1829.00
Current Support: 1819.00
High Target: 1844.00
Low Target: 1802.00

