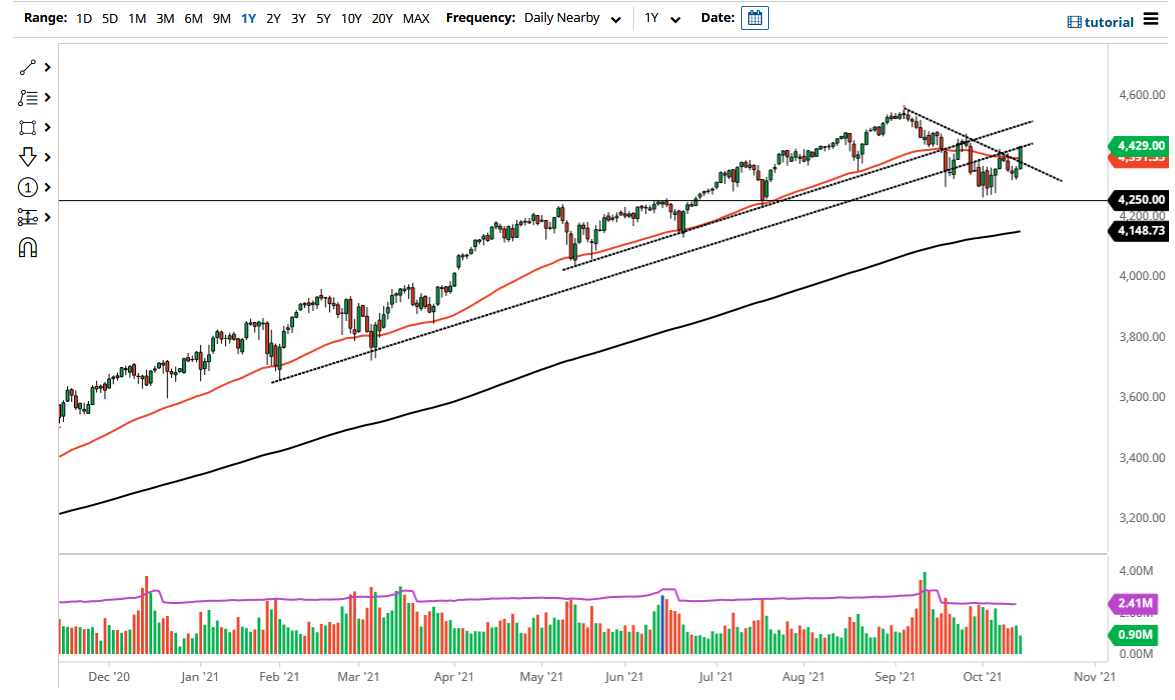
The S&P 500 rallied quite significantly to reach much higher during the trading session on Thursday, clearing both the 50 day EMA and the downtrend line that I have drawn on the chart. In fact, we are closing towards the top of the range, which is a very bullish sign. Going even further into this, you could make a bit of an argument for an inverted head and shoulders, so all of this leads me to believe that the market is going to continue going higher, with a potential target of 4650.
All things been equal, this is a market that has been in an uptrend for quite some time anyway, and of course this recent pullback, albeit somewhat concerning, the reality is that it is relatively minor in general, and with that being the case I think it is difficult to imagine a scenario where you can short this market. The stock markets continue to attract money, if for no other reason than the fact that we have had a major amount of money flowing into the markets, and therefore it does not really have anything else to do than to go looking towards returns in the stock market.
When I look at this chart, it is obvious to me that the 4250 level is important, and as a result I look at that as a floor in the market. The market breaking down below there could open up fresh selling, but at this point I would look at that more or less as an opportunity to buy puts, because the market is one that is so highly manipulated by the Federal Reserve. The market breaking down below there is a short-term opportunity at best, and as a result I have no interest whatsoever in trying to get too cute with this move.
In the meantime, I believe that short-term pullbacks will continue to be buying opportunities, especially on signs of a short-term bounce. I think that will continue to be the way most people look at this market, so do not get aggressive to the other direction, and recognize that this has been a “one-way trade” for the last 13 years, with little signs of it changing anytime soon. Keep your position size reasonable and only add once the market has moved in your favor, showing you that it is in fact time to profit.

