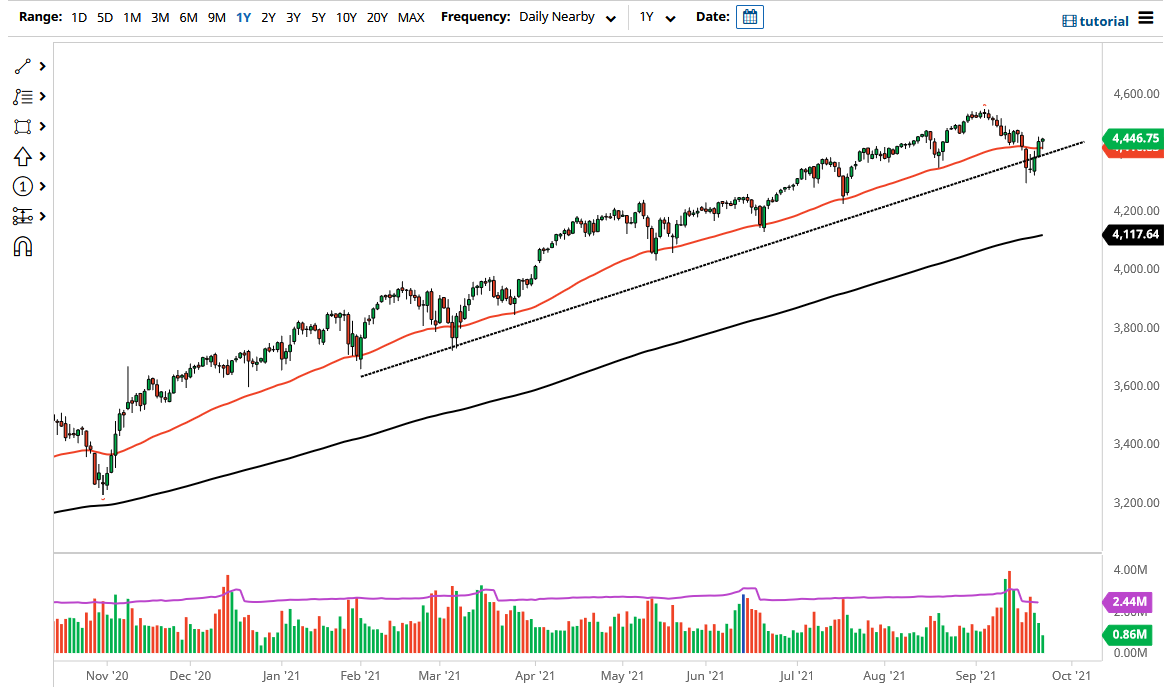
The S&P 500 pulled back a bit on Friday only to find the 50-day EMA supportive enough to turn around and show signs of strength. If we break above the top of the candlestick, then it is very likely that we go looking towards the 4600 level. That being said, the market has been in a bullish trend for quite some time, and the fact that we have turned around to show signs of strength is a good sign that we are going to continue going higher. The previous uptrend line being broken to the downside and then the market reversing is essentially what is known as a “throw over.” This is also quite often called a “false breakout.”
Looking at this chart, I do believe that it is worth looking at this market as one that will continue to show buying opportunities going forward. If we can break above the 4480 level, then I think we are likely at the very least to test the recent highs. The market will continue to see a lot of value hunters out there, but you should be cautious about the overall position size.
If we break down below the bottom of the Monday candlestick, then I would be a buyer of puts, as I would anticipate this market dropping down to the 4200 level. The 200-day EMA is racing towards that area, which would be a target for me as far as buying puts is concerned. That being said, I am not going to short this market, because it is far too manipulated by the Federal Reserve. The Fed tends to jump into the market at the first sign of trouble for Wall Street, and I would anticipate that that will continue to be the case.
Even though the interest rates are climbing a bit in the United States, they are still low enough for people to be interested in buying stocks. This is a market that continues to go higher over the longer term, and as a result, value hunting continues to be the best way going forward. The 50-day EMA has flattened out, so perhaps we are to simply going to grind sideways overall. That would make a certain amount of sense due to the fact that we have been in a long-term uptrend for quite some time.

