Bullish view
- Buy the BTC/USD and add a take-profit at 55,000.
- Add a stop-loss at 50,000.
- Timeline: 2 days.
Bearish view
- Set a sell-stop at 52,000 and a take-profit at 50,000.
- Add a stop-loss at 54,000.
The BTC/USD price relentless rally continued on Tuesday as investors remained optimistic about the industry. The pair jumped to 52,748, which is about 83% above the lowest level in July this year. In other words, Bitcoin has gained by more than $22,000 in the past few weeks.
Rising Demand for Bitcoin
The BTC/USD price rally is continuing as demand remained relatively high. This happened after El Salvador became the first country to use Bitcoin as a legal tender. The government initially bought 200 Bitcoins, which are worth more than $10 million.
Bitcoin is also seeing more demand from institutional investors who want to have exposure in the industry. On Monday, it was reported that Union Capital, a German asset manager was seeking to have exposure to Bitcoin for several of its funds. Other large investors are also seeking to either buy or add to their Bitcoin holdings.
Meanwhile, on-chain metrics have been supportive of Bitcoin prices. For example, after dropping substantially in July, the total number of active addresses has started to rebound. There are more than 898k active Bitcoin addresses, which is substantially higher than July’s low of less than 800k. At the same time, the hash rate has also jumped, signalling that there is a resurgent recovery.
The overall performance of the US dollar has also contributed to the BTC/USD performance. The US dollar index has remained under pressure in the past few days after the US published the relatively mixed jobs numbers. The data revealed that the economy created 235k jobs in July while the unemployment rate fell to 5.2%. These numbers signal that the Fed will likely embrace a wait and see attitude before tapering.
BTC/USD Technical Analysis
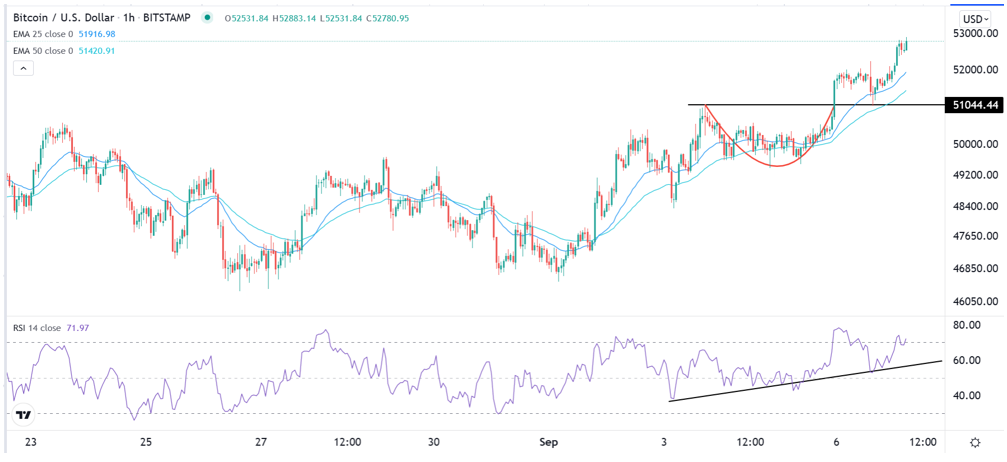
The hourly chart shows that the BTC/USD has been in a strong bullish trend in the past few days. This trend has seen the pair rise to a multi-month high of 52,760. Along the way, the pair has moved above the short and longer-term moving averages.
Bitcoin also rose above the key support level at 51,045, which was the highest point on September 3. It was also the upper part of the cup and handle pattern shown in red. At the same time, the Relative Strength Index (RSI) has been in an upward trend. Therefore, the pair will likely continue rising as bulls target the key resistance at 55,000.

