The difference between success and failure in Forex trading is very likely to depend mostly upon which currency pairs you choose to trade each week and in which direction, and not on the exact trading methods you might use to determine trade entries and exits.
When starting the trading week, it is a good idea to look at the big picture of what is developing in the market as a whole and how such developments and affected by macro fundamentals and market sentiment.
There are few long-term strong valid trends left in the market, but a few attractive opportunities remain, such as the U.S. stock market which is continuing to make new record highs.
Big Picture 25th July 2021
Last week’s Forex market was relatively quiet. This was due party to the fact that we are well into the summer season in the northern hemisphere when global markets tend to get becalmed, and partly because there was little high-impact market data last week excepting the European Central Bank’s monthly policy release.
I wrote in my previous piece two weeks ago that the best trade was likely to be going long of the S&P 500 Index. Since then, the S&P 500 Index has risen by 0.97%.
Fundamental Analysis & Market Sentiment
The headline takeaways from last week were the economic impact of the resurgent coronavirus globally driven by the delta variant, and the European Central Bank’s monthly policy release which gave a very small dovish tilt to its monetary policy. The ECB’s release had little impact, but the at least partially vaccine-resistant spread of the coronavirus is beginning to darken economic horizons. For example, although the UK is relaxing all virus restrictions, the need for exposed persons to enter quarantine may be beginning to have an economic impact. In Australia, where more than half the population is subject to strict lockdown, retail sales have dropped strongly, and the situation may be contributing to the recent weakening of the Australian dollar.
Next week will bring a much busier data schedule, notable the FOMC statement, federal funds rate, and press conference, as well as US advance GDP data, Australian and Canadian inflation data, and Canadian GDP numbers. The Forex market is therefore likely to be much more active next week.
Last week saw the global number of confirmed new coronavirus cases and deaths rise for the fifth consecutive week after falling for two months previously, suggesting that the spread of the more highly infectious Delta (Indian) variant is having a real impact on global numbers even though approximately 27.1% of the global population has by now received at least one vaccination.
There are now 15 countries which have fully inoculated more than 60% of their respective populations. Immunization is now proceeding more quickly in the European Union than it is in the U.S. although the U.S. is ahead of the E.U. with 49% of its population fully vaccinated, while the E.U. is at 45%. A few nations have begun vaccinating older children to reach a “herd immunity” against the Delta variant, which is believed to require the inoculation of at least 80% of the entire population – this level has only been achieved in Malta, although significantly, Malta has seen new cases rise firmly over recent days, suggesting that the delta variant is able to partially overcome inoculation at least in terms of infection. New data from Israel suggests that the vaccines may only give 40% protection against infection while still giving 88% protection against serious illness, although this data is still disputed.
The strongest growth in new confirmed coronavirus cases right now is happening in Algeria, Andorra, Australia, Burma, Cuba, Finland, France, Georgia, Greece, Iceland, Iran, Iraq, Japan, Laos, Malaysia, Mauritius, Morocco, Philippines, Portugal, Spain, the U.S., and Uzbekistan.
Technical Analysis
U.S. Dollar Index
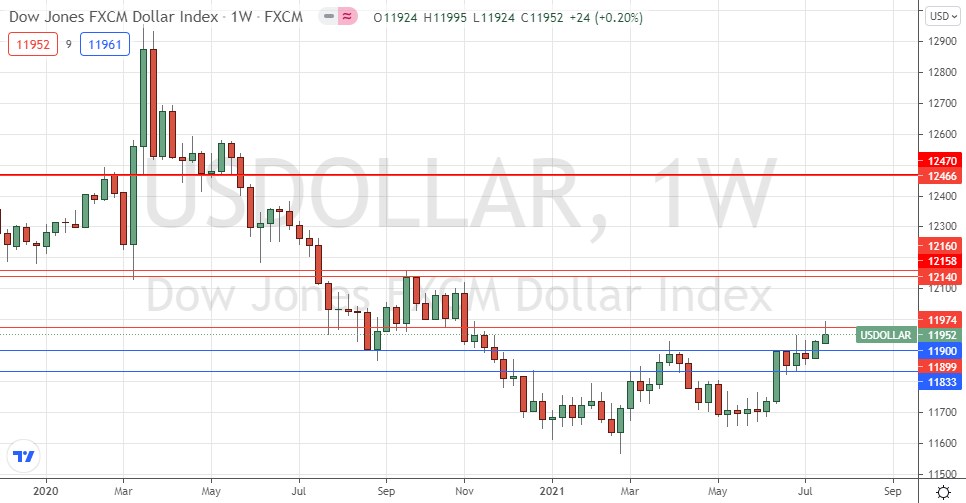
The weekly price chart below shows the U.S. Dollar Index printed a weakly bullish candlestick last week that arguably, is close to being a bearish pin candlestick. However, the fact that the price was able to break above the former resistance level at 11900 is a bullish sign, although the candle closed within the bottom half of its range and that we seem to have printed a new obvious resistance level at 11974 which remains intact. The Index is above its levels from both three and six months ago which shows a long-term bullish trend is still in force. Overall, next week’s price movement in the U.S. dollar looks slightly more likely to be upwards due to the trend. This suggests that trades long of the USD against other currencies are most likely to be appropriate over this coming week, especially if the index is trading above the close resistance level at 11974.

S&P 500 Index
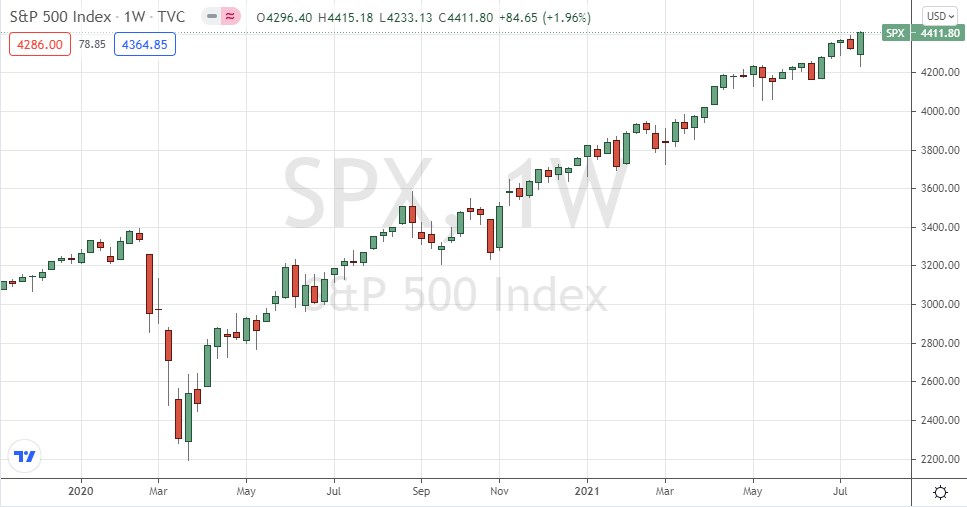
The S&P 500 Index printed a relatively large and strong bullish candlestick which closed right at the top of its weekly range at an all-time high price above the round number at 4400. These are simply very bullish signs which indicate a further rise next week is more likely than not to happen. Since the coronavirus crash of 2020, this major U.S. equity index has more than doubled in value, which is an excellent return over barely sixteen months. The S&P 500 Index remains a buy.

NASDAQ 100 Index
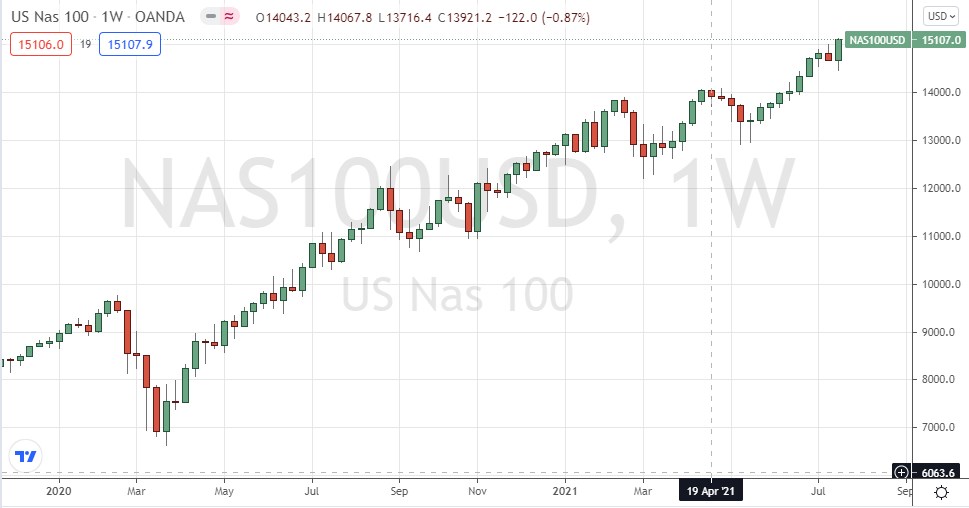
The NASDAQ 100 Index printed a large and strong bullish candlestick which closed near the top of its weekly range at an all-time high weekly closing price. These are simply very bullish signs which indicate a further rise next week is more likely than not to happen. Since the coronavirus crash of 2020, this major U.S. tech equity index has more than doubled in value, which is an unbelievably excellent return over barely sixteen months. The NASDQ 100 Index remains a buy.

EUR/USD
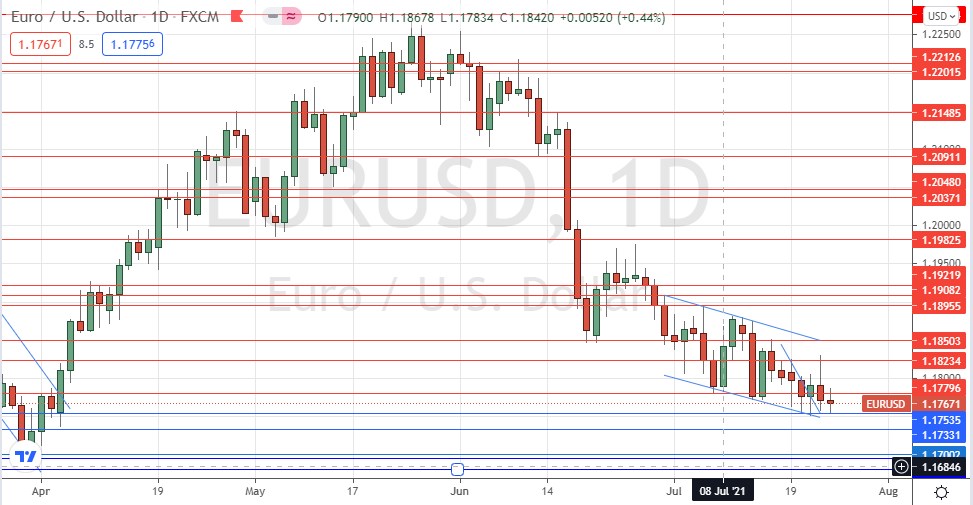
The EUR/USD currency pair has made several new 50-day low closes over recent days, suggesting we are likely to see lower prices here over the coming days. This bearish outlook is reinforced by the clear bearish price channel drawn within the price chart below and is in line with the bullish US dollar outlook outlined earlier. Despite this bearish situation, the price is showing a reluctance to fall strongly, so it will probably be wise to wait for a daily (New York) close below the key support level and big quarter-number at 1.1750 before entering a new short trade in this currency pair.

Bottom Line
I see the best opportunity in the financial markets this week as being long of the S&P 500 and NASDAQ 100 indices, plus going short of the EUR/USD currency pair following a daily (New York) close below 1.1750.
