The difference between success and failure in Forex trading is likely to depend mainly on which currency pairs you choose to trade each week and in which direction, and not on the exact trading methods you might use to determine trade entries and exits.
When starting the trading week, it is a good idea to look at the big picture of what is developing in the market as a whole and how such developments are affected by macro fundamentals and market sentiment.
The EUR/USD and the GBP/USD could be poised to start new downtrends. The USD/CAD could be starting a new uptrend based on a long-term support level from 2017. And the S&P 500 is still going up!
Big Picture, 18th July, 2021
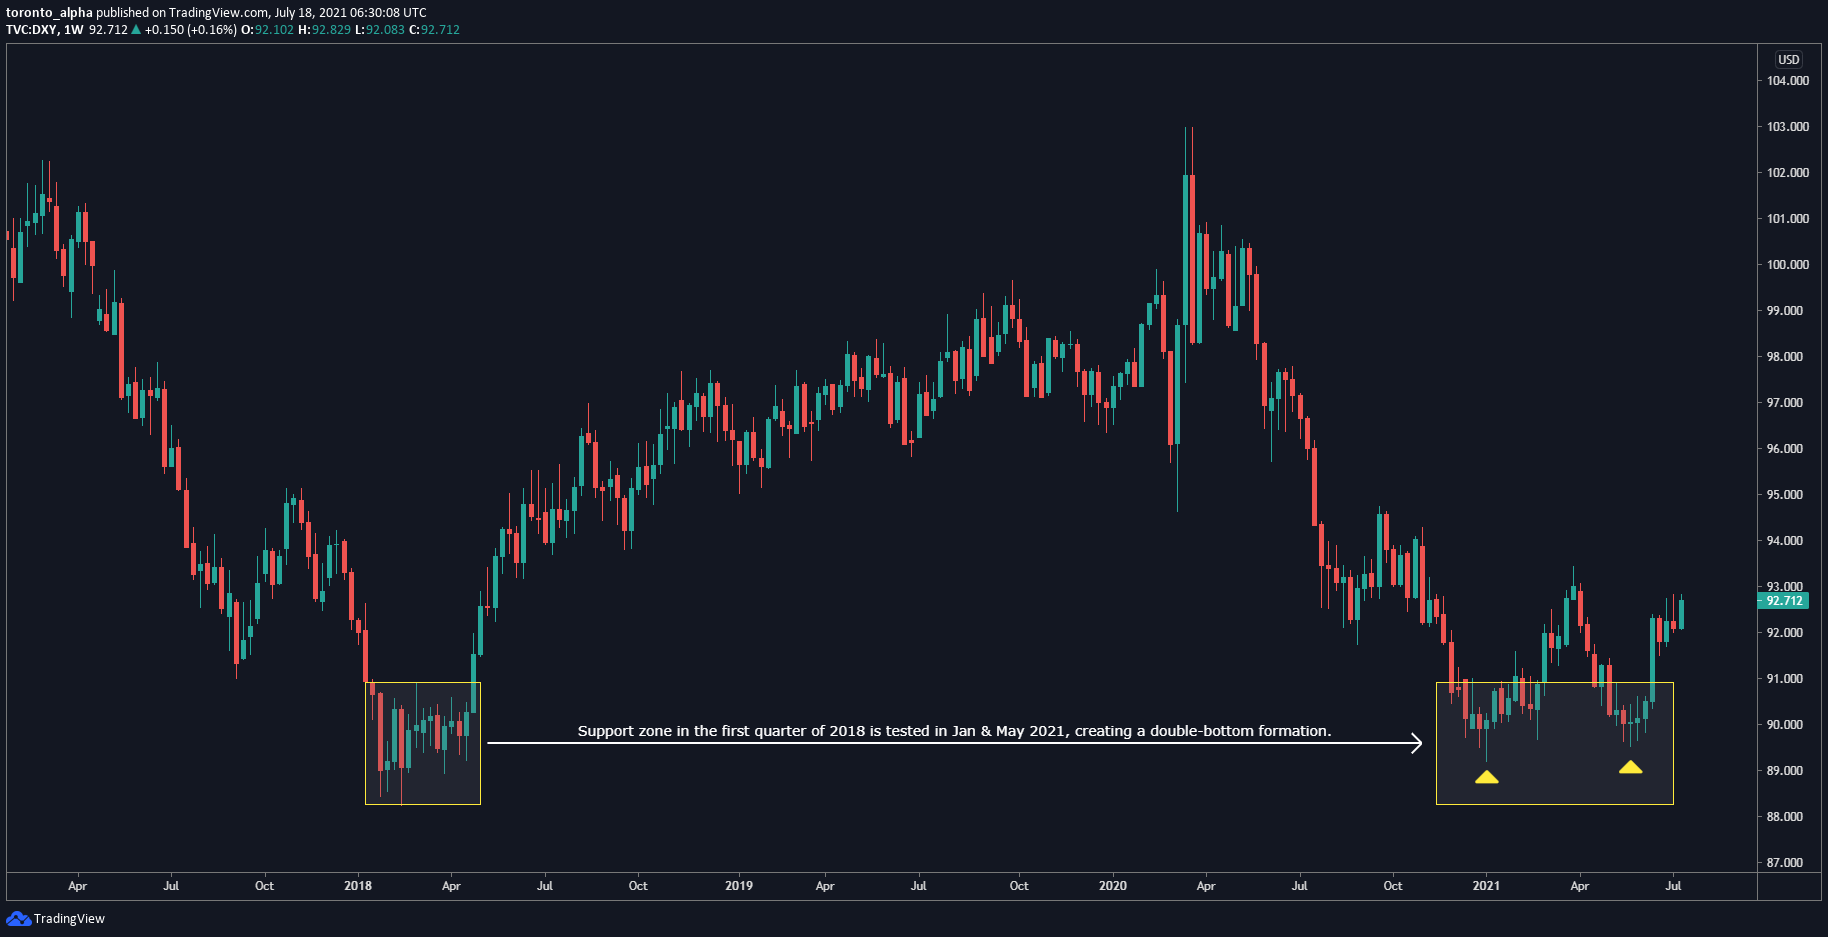
The US Dollar Index created a double-bottom formation on the chart in January and May 2021, which lined up with a support area made in early 2018. The index subsequently made a jump in value in the week of 14th June, which looks like the first impulse of a new uptrend. Last week saw the US Dollar Index post another bullish week.
Last week, the biggest day for Forex majors and the DXY was Tuesday, 13th July, when the U.S. CPI numbers were released. Inflation has been a recurring theme in market commentary for some months. The public is learning about esoteric items such as the jump in lumber prices and lumber futures (something I didn’t know existed until recently!). Federal Reserve spokespeople talk of the high inflation numbers as transitory and resulting from the COVID-19 recovery with its pent-up demand. Fund managers, including giants such as Warren Buffet and Michael Burry, aren’t buying that assessment and instead are saying that this current inflation spike is just the beginning of more inflation and that true inflation is much higher than the reported CPI numbers.
Vaccines have been with us for months now, with some countries, such as Israel and Canada, posting impressive vaccination stats. Yay! But numbers of unvaccinated people in many countries remain high. As world leaders relax social distancing rules to help their economies, another spike in COVID-19 cases has appeared especially amongst unvaccinated people, fueled in part by more transmittable variants, especially the Delta variant. We’re seeing stories of hospitals that are doubling or quadrupling their COVID-19 admissions, and oxygen again being in short supply, reminiscent of the early days of the COVID-19 outbreak. Death is not the only metric to measure Covid-19 effects – long-term symptoms are revealing themselves too. Indonesia has appeared as a new COVID-19 epicenter.
The world has seen extreme weather events – record temperatures in western North America, flooding at never-seen-before levels in Western Europe that has taken hundreds of lives and destroyed communities. This is almost certainly due to climate change. What’s striking is these weather events have happened in first-world countries that many thought were safer harbors from climate change.
Billionaires have started their own space race! Richard Branson, of Virgin Galactic, flew to the edge of space last week. Jeff Bezos is soon to follow. We miss the good old days of U.S. versus the USSR battling it out for dominance above the Earth!
S&P 500
“Buy the stock market, and just hold it” was the very first piece of advice I was given about investing. When I look at the recent actions of the S&P 500, nothing feels truer. The index has shaken off, with remarkable speed, any concern you could throw at it. We could dabble into the reasons why, from the U.S. Federal Reserve corporate bond purchases to a flood of capital allowing even greater stock buybacks, and so on. Even the recent inflation concerns, backed by CPI data showing startling inflation numbers, have given the market pause for only a day or so before continuing its upward march.
At the risk of being called Captain Obvious, the S&P 500 shows a clean, non-volatile uptrend. Pure and simple. Buy on dips and trail your stops.
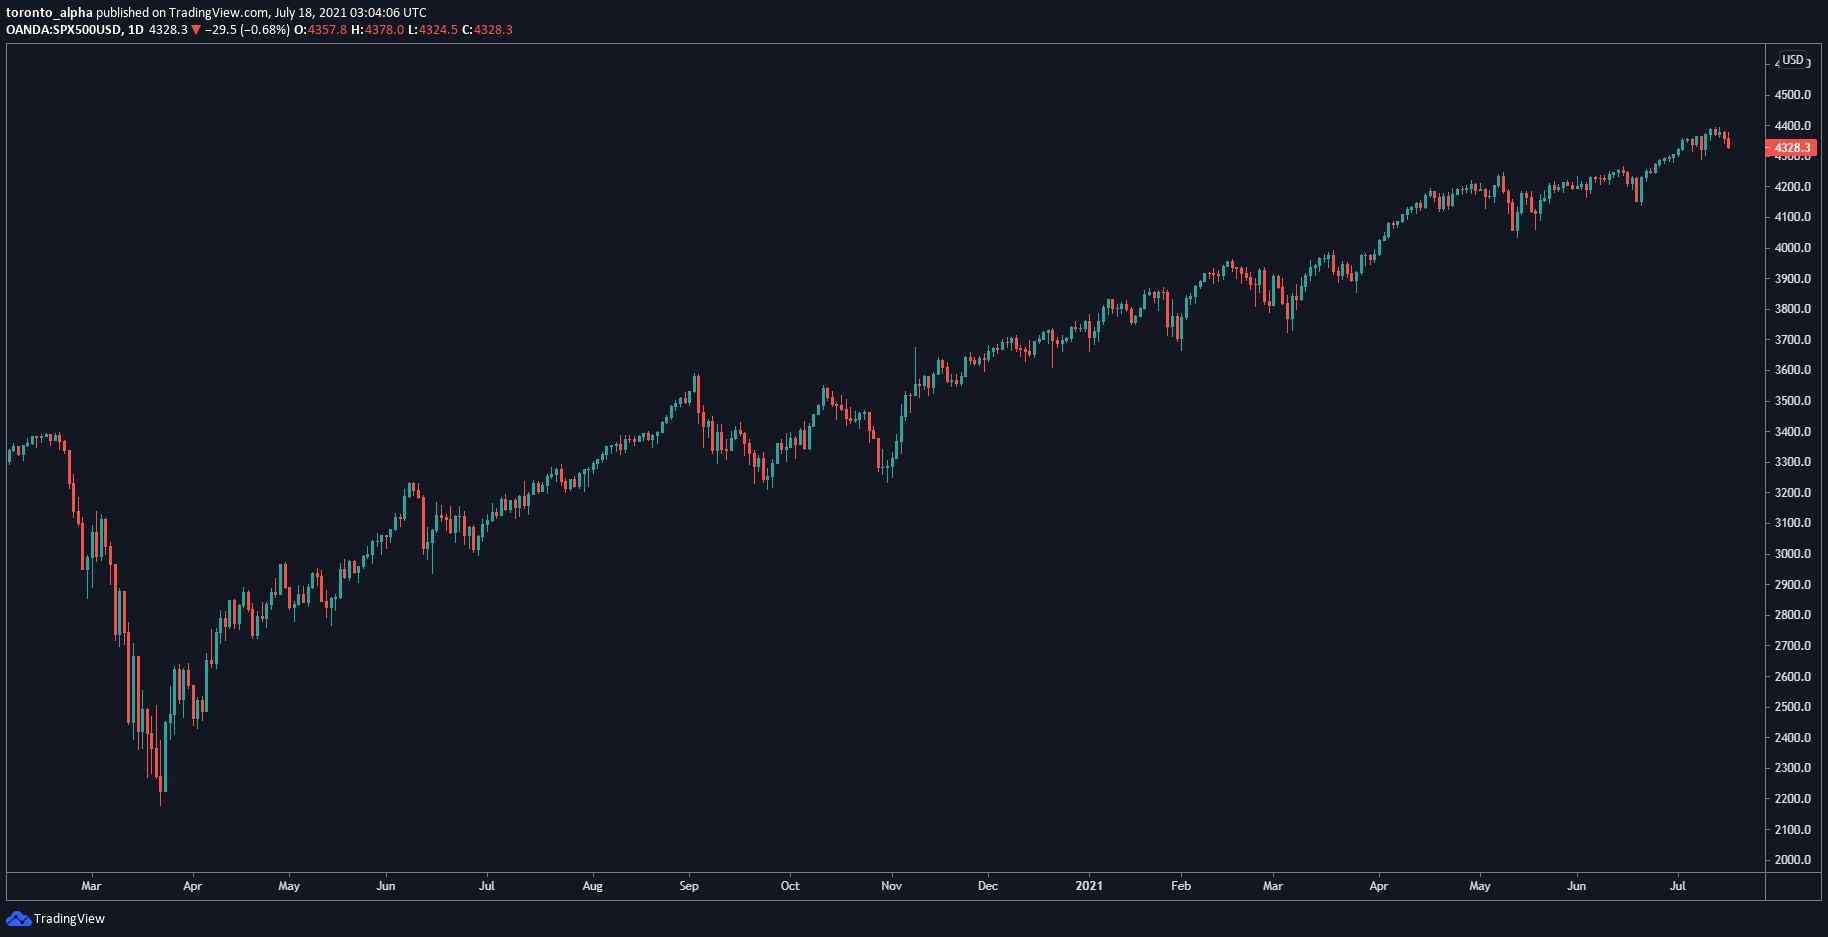
Last week, the market had a down week with a close at the bottom half of the range. This has only happened six times this year (out of 27 trading weeks), and only twice this year has the market experienced two consecutive down weeks.
So, the market could be going through a temporary dip. If the market continues to fall, a strategic entry area on the chart is around the 4245.5 level as this previous resistance could act as a support level.
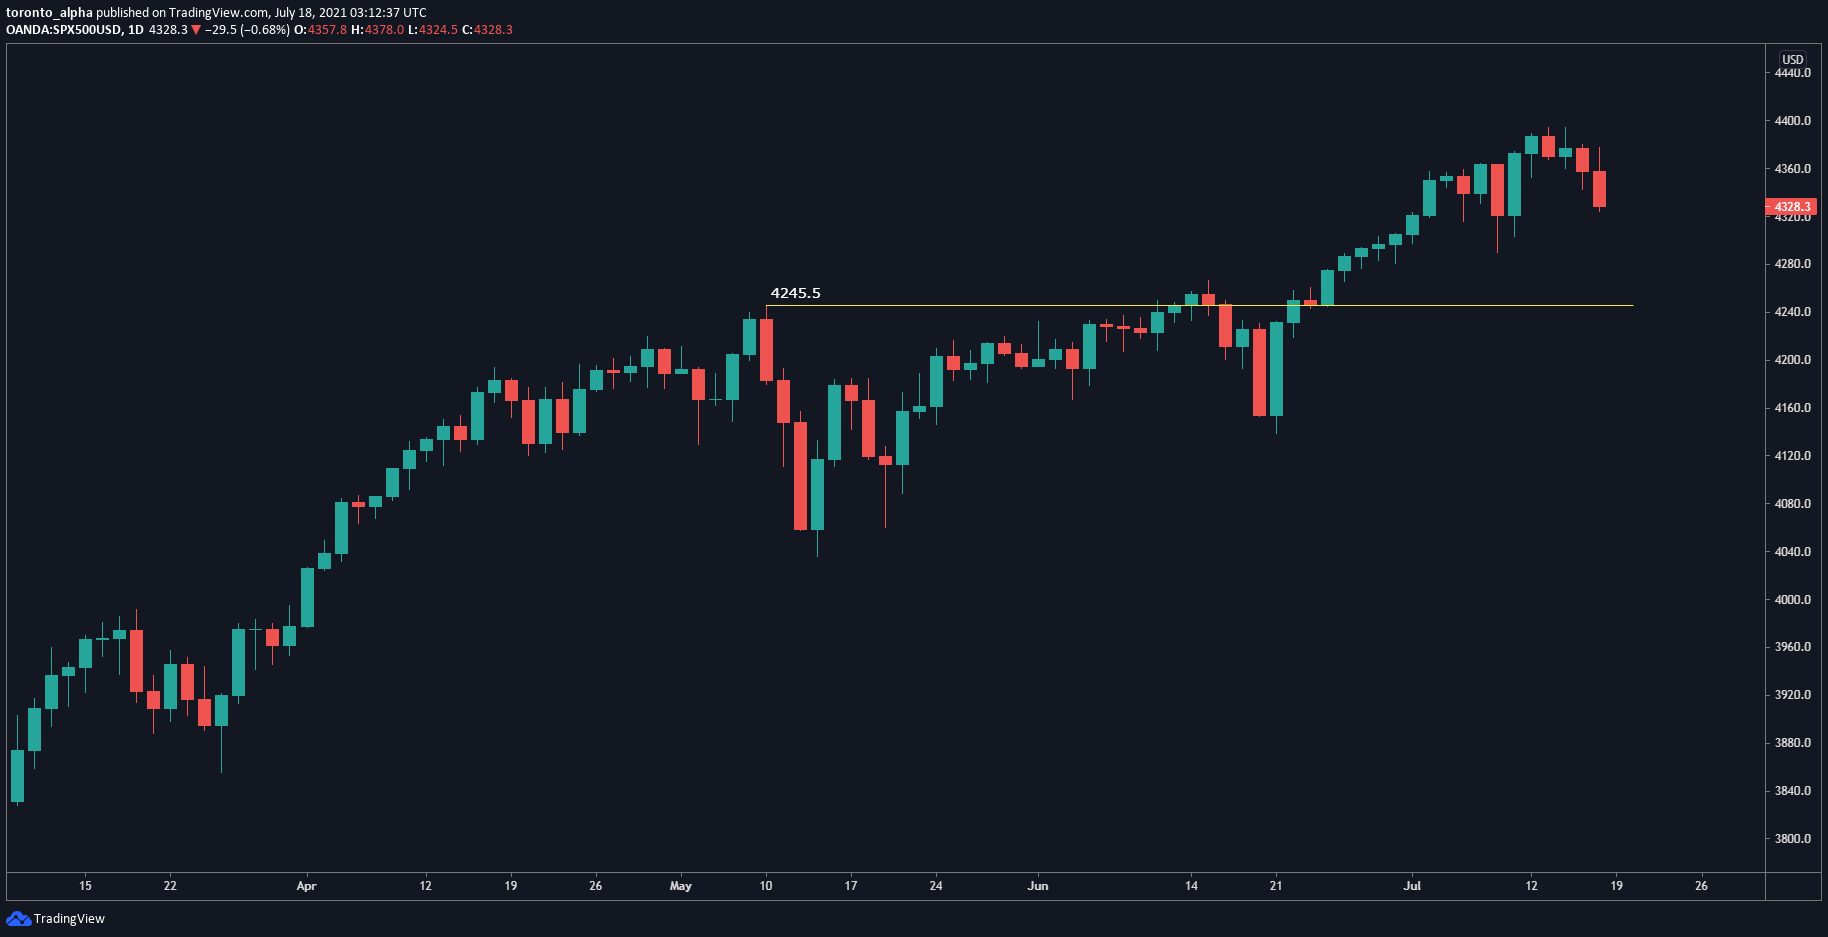
What would make me reconsider the uptrend and look for a potential market top? If the market broke support levels at 4138, made on 21st June, and 4035, made on 13th May. The last significant support was made way back in September 2020 at 3210.
EUR/USD
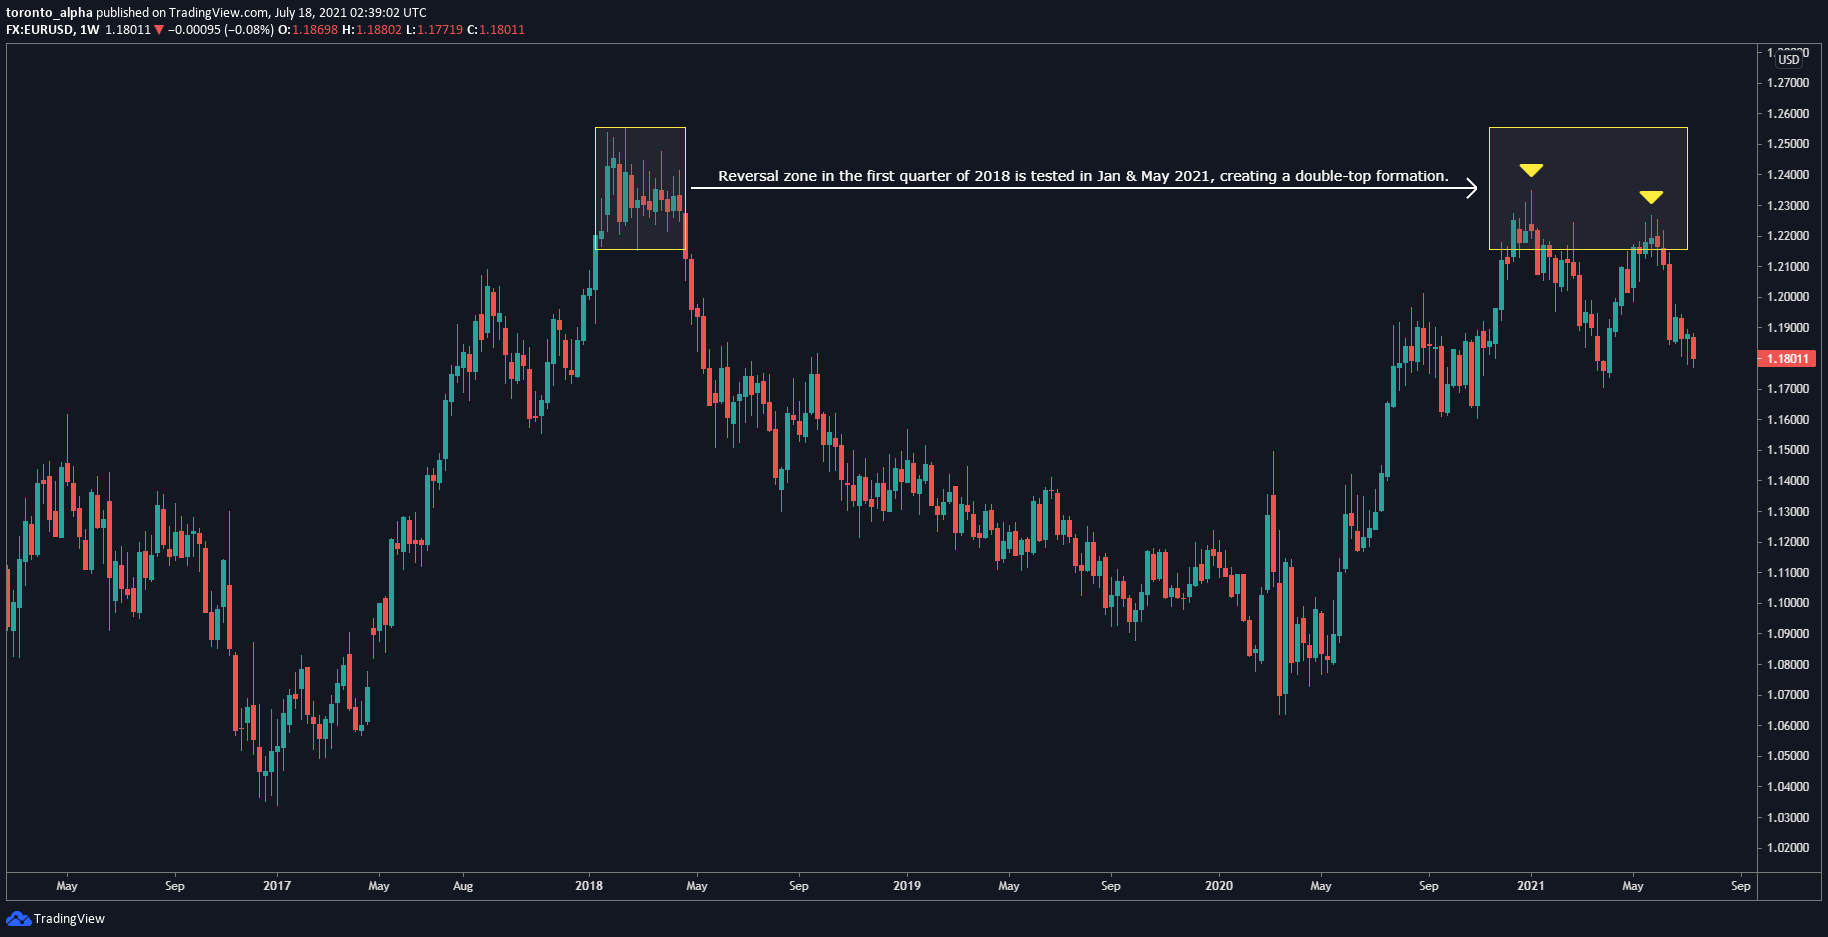
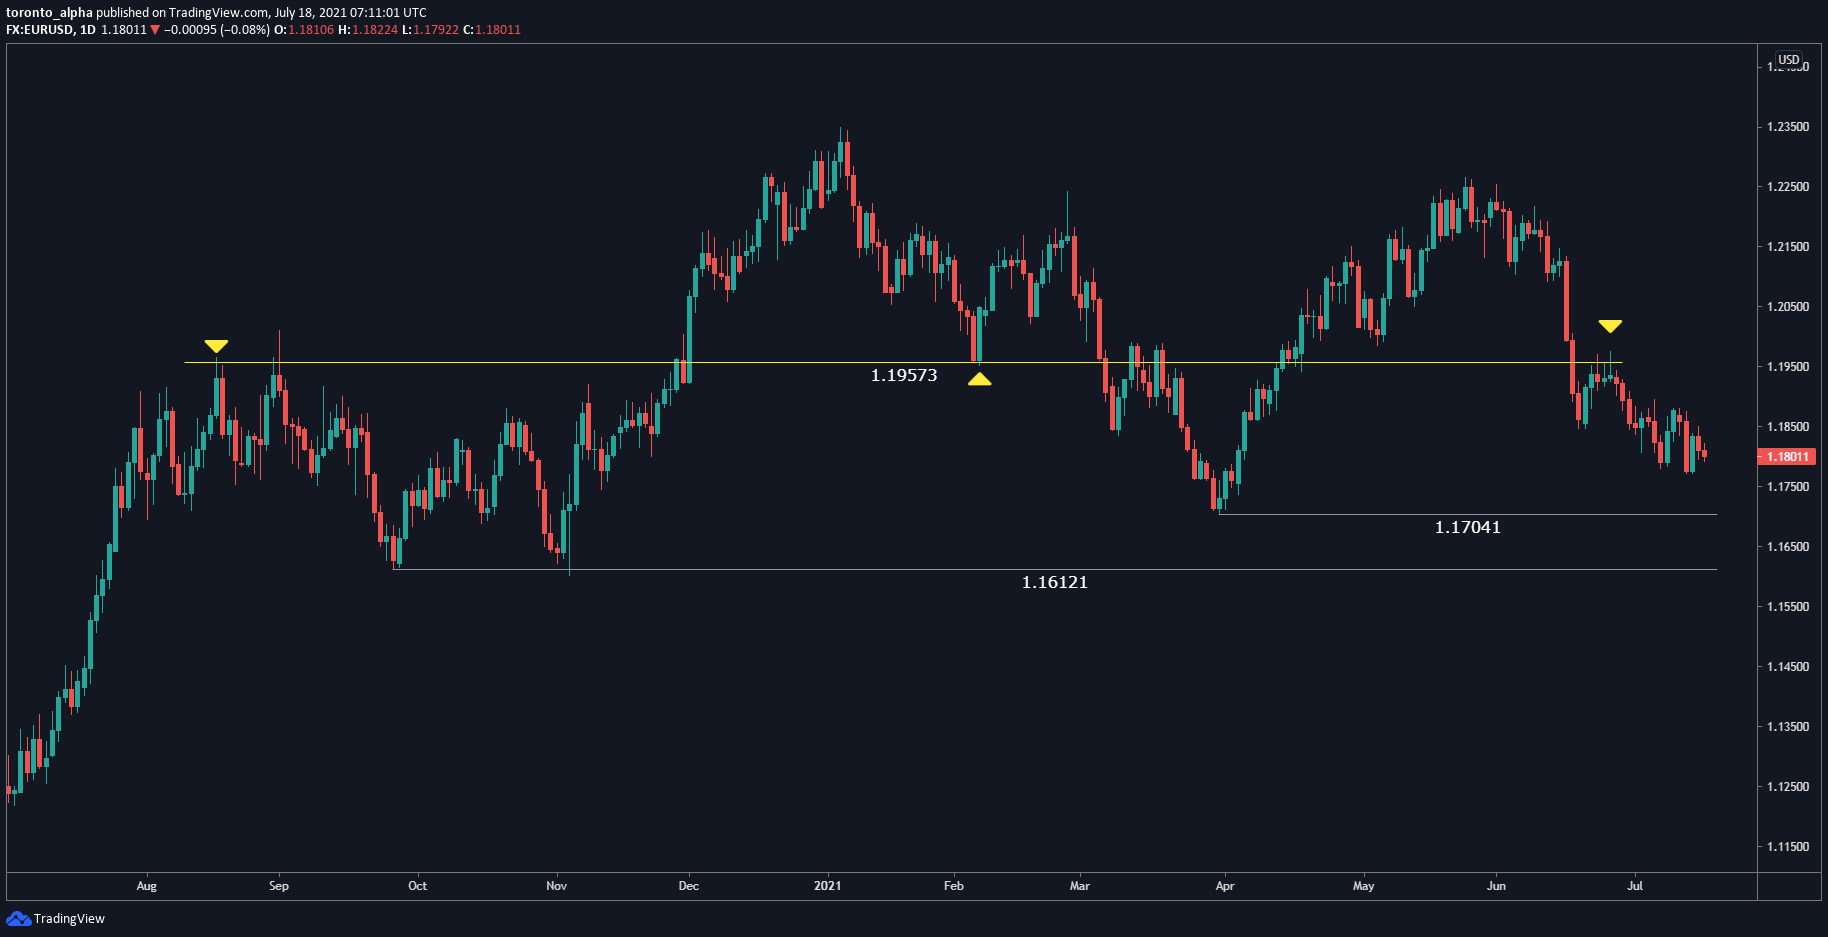
The EUR/USD is potentially starting a new downtrend. A reversal zone made in the first quarter of 2018 was tested in January 2021 and May 2021, creating a double-top formation on the chart.
On the daily chart, the market is below 1.19573, a key interchangeable support/resistance level. The next supports price must break to continue trending down are 1.17041 and 1.16121.
GBP/USD
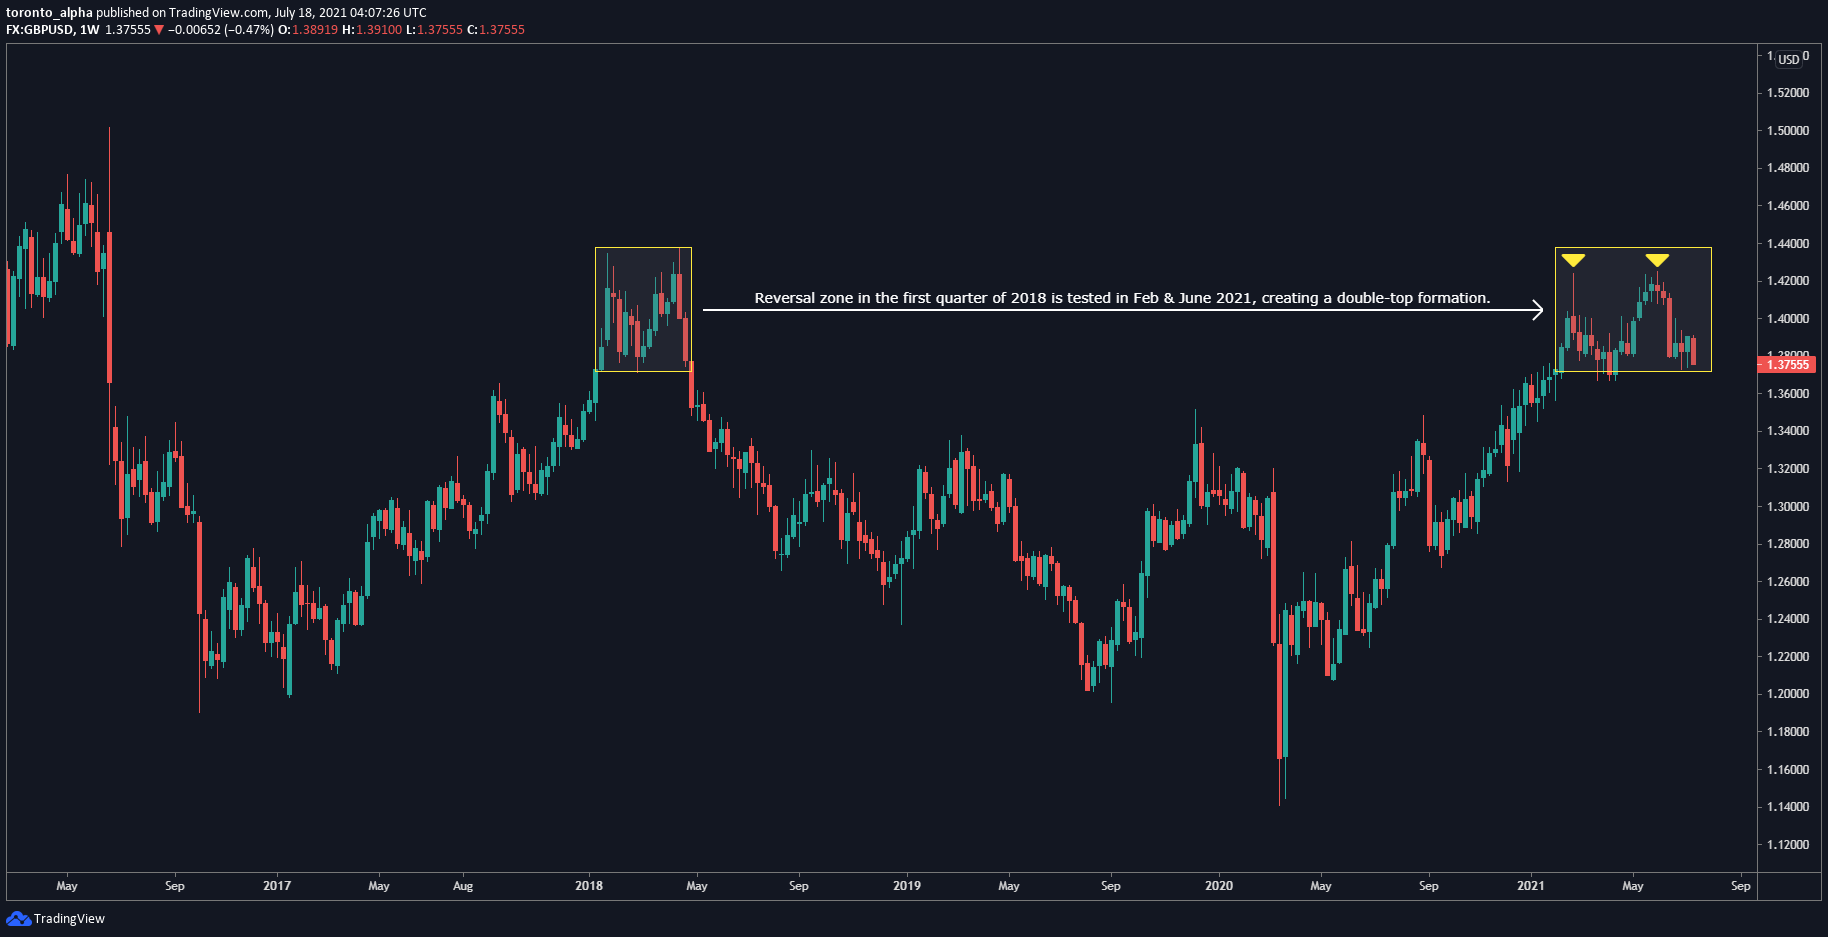
The GBPUSD is showing a potential downtrend, similar to the EUR/USD. A reversal zone made in the first quarter of 2018 was tested in February 2021 and June 2021, creating a double-top formation on the chart.
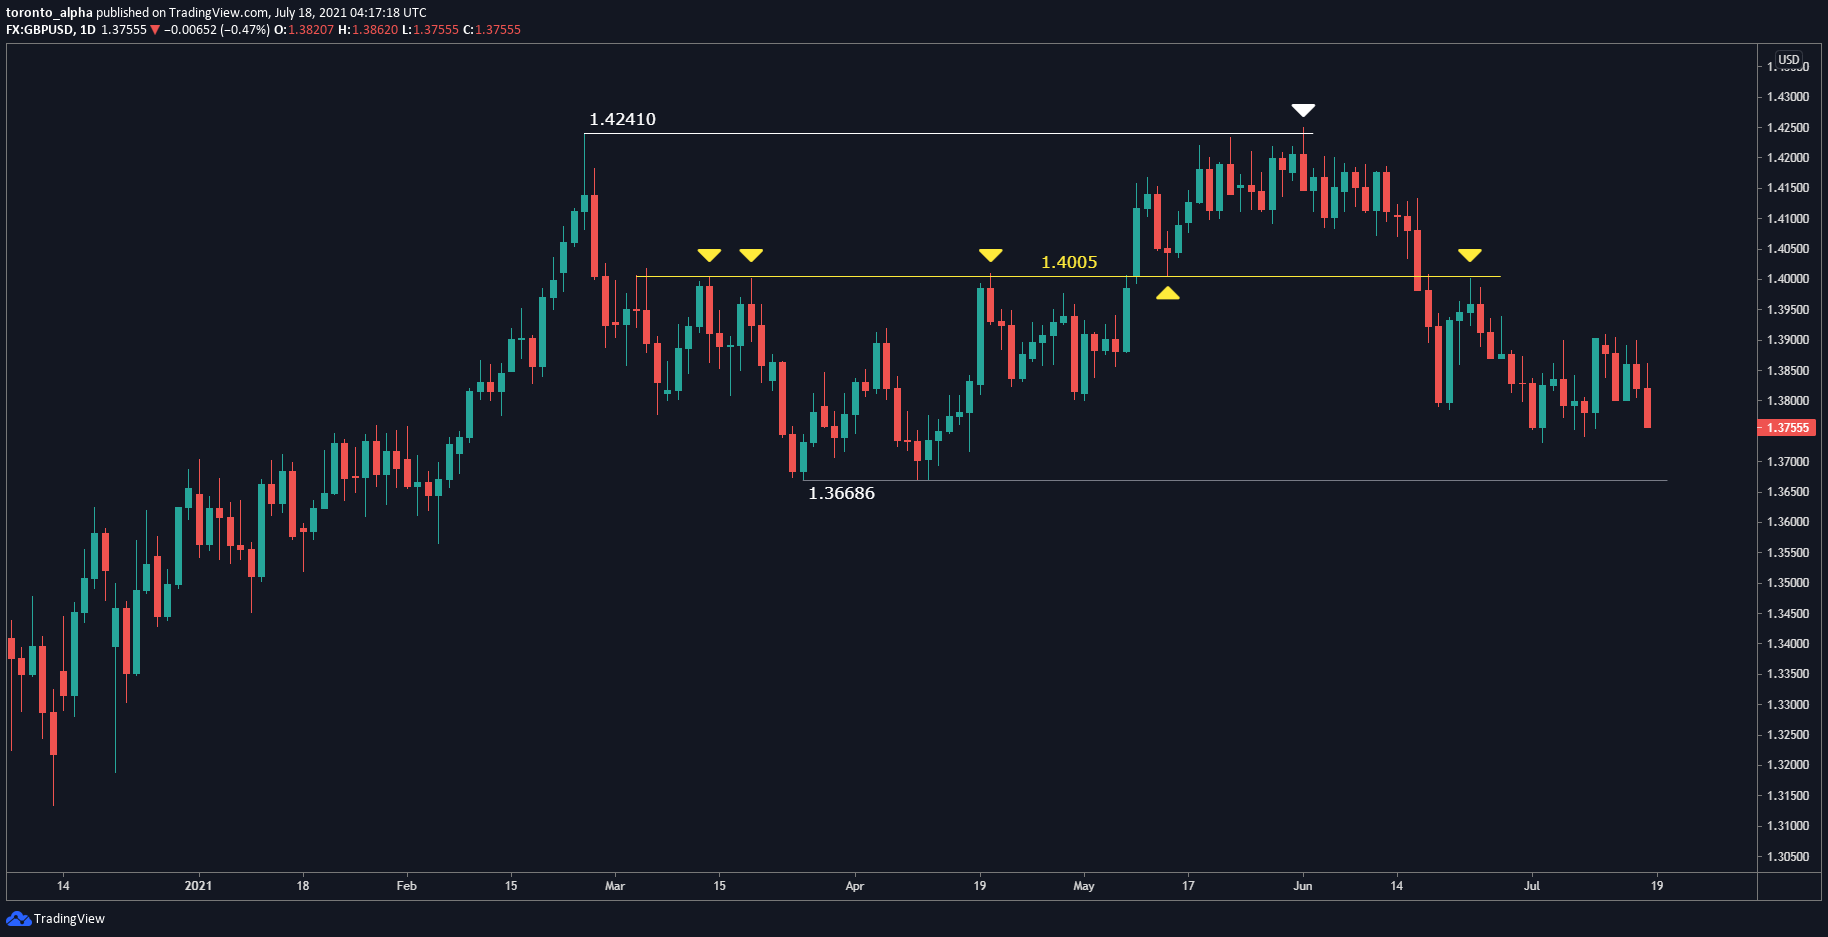
On the daily chart, the market is below 1.4005, a key interchangeable support/resistance level. The next support price must break to continue trending down is 1.36686.
USD/CAD
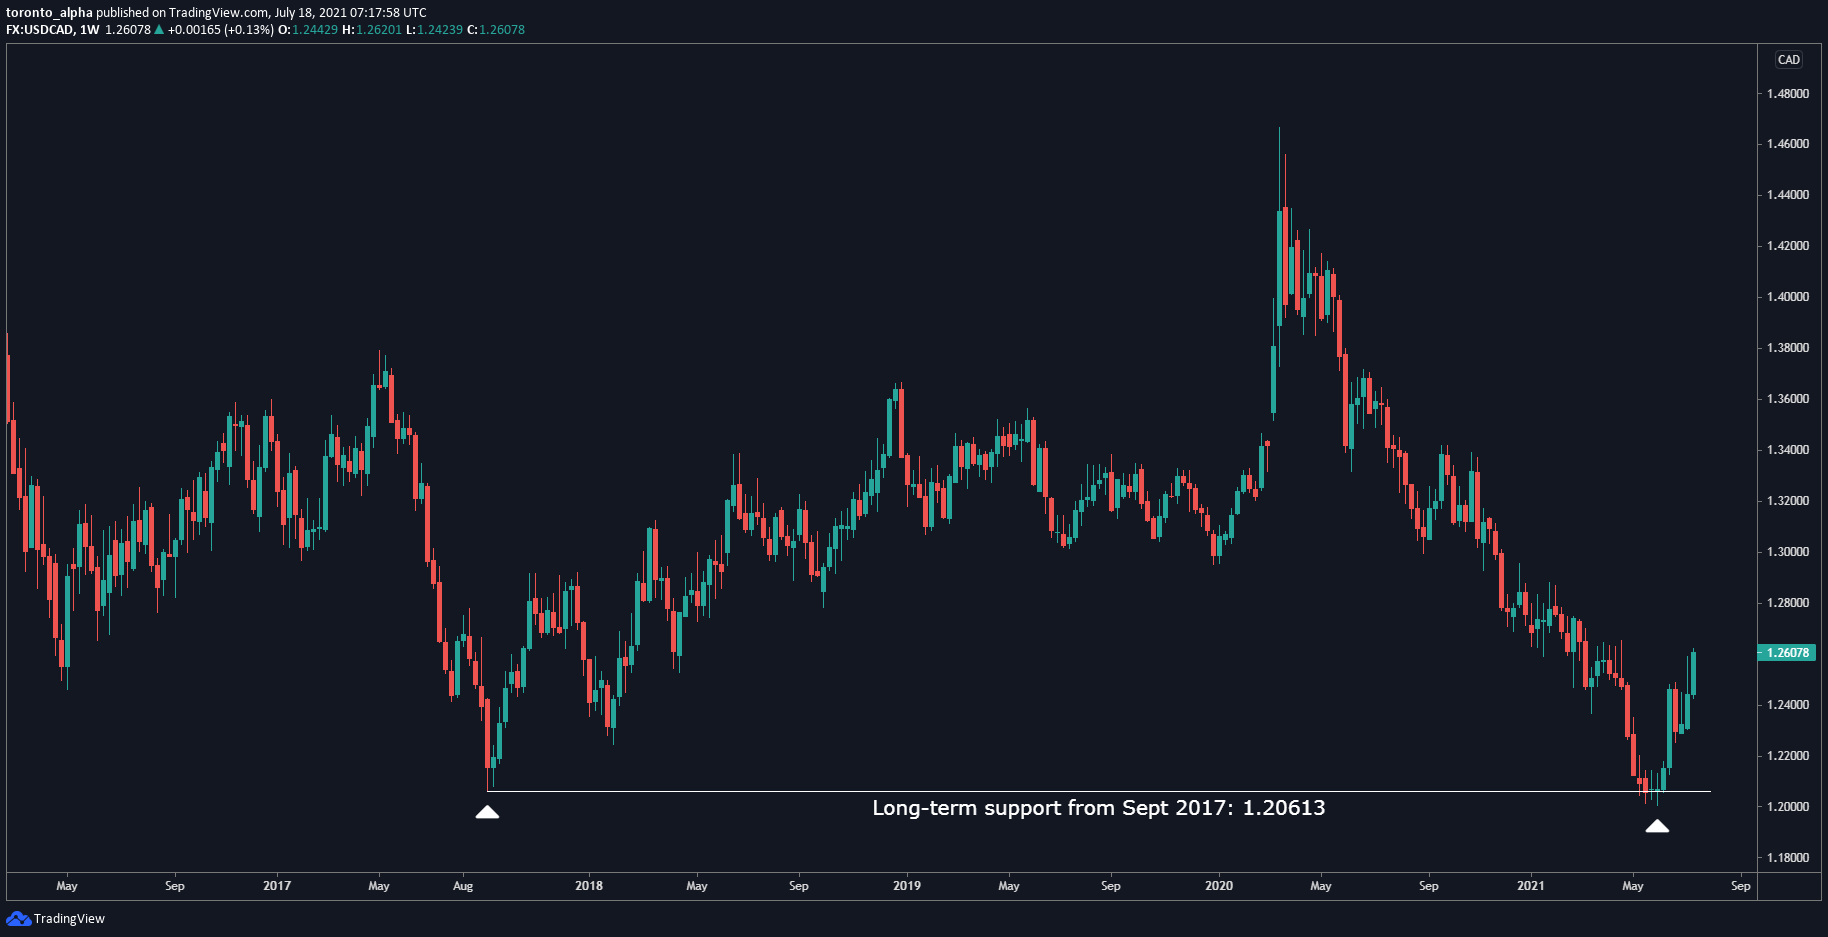
USDCAD, in late-May/early-June 2021, bounced off a long-term support level at 1.20613 made in September 2017. Last week, it posted an impressively bullish week. This is a potentially long-term play, but USDCAD could be in for a lengthy bull run through 2021.
The best opportunities I see in the markets are long S&P 500 – I would look at the 4-hour chart to buy off supports. I see short opportunities in EUR/USD and GBP/USD – similarly, I would look at the 4-hour chart to enter off resistances. I see a potentially long-term bullish trend unfolding in USD/CAD.
