The difference between success and failure in Forex trading is very likely to depend upon which currency pairs you choose to trade each week, and not on the exact trading methods you might use to determine trade entries and exits. Each week I am going to analyze fundamentals, sentiment and technical positions in order to determine which currency pairs are most likely to produce the easiest and most profitable trading opportunities over the next week. In some cases it will be trading the trend. In other cases it will be trading support and resistance levels during more ranging markets.
Big Picture 30th December 2018
In my previous piece last week, I was long Gold/USD and USD/CAD and short of the S&P 500. This was a partially good call as Gold rose by 2.00%, USD/CAD rose by 0.32%, but the S&P 500 Index rose by 3.55%, so the forecast produced an averaged loss overall of 0.41%.
Last week saw a rise in the relative value of the Swiss Franc, and a fall in the relative value of the Australian Dollar.
Last week’s Forex market was quite noisy and was dominated by continuing weaknesses in crude oil, commodity currencies and a rise in safe havens including precious metals. The major index for the U.S. stock market, the S&P 500 Index, was briefly in bear market territory with a loss of more than 20% from its peak which was reached less than three months ago.
This week is likely to be dominated by what happens to the U.S. stock market, which seems likely to fall further, and this would suggest that the currencies and precious metals which performed strongly or weakly last week are likely to do so again this week.
Fundamental Analysis & Market Sentiment
Fundamental analysis seems to be increasingly turning against the U.S. Dollar, as the stock market dips into bear territory and the President excoriates the Federal Reserve for its recent rate hike. It is looking increasingly likely that the Federal Reserve will be too afraid to hike rates any further, and this is likely to weaken the U.S. Dollar. The U.S. will need more capital inflow and that is going to be difficult to achieve in the current environment. Dollar yields are very weak and the trade war with China has only been paused, not resolved.
Brexit remains an unknown, and the situation is unlikely to be clarified until Parliament starts to prepare for a new vote on a possible deal by approximately 14th January.
Commodity currencies are getting hit hard over he downturn with the Australian Dollar being especially vulnerable to the trade war between China and the U.S.A.
Technical Analysis
U.S. Dollar Index
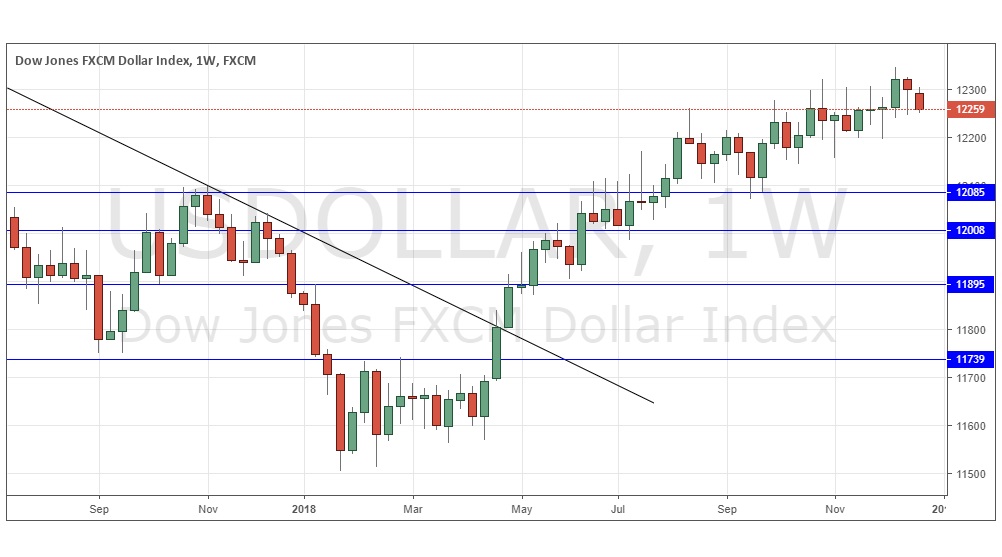
The weekly price chart below shows that last week the USD Index fell and printed a bearish candlestick that was not large but did close near its low. This is a bearish development, but it should still be noted that the price remains in a long-term bullish trend. However, it is looking quite possible that the coming days will see the Dollar fall and end this trend. The former support level nearby has been invalidated, so the price has room to fall.
Silver
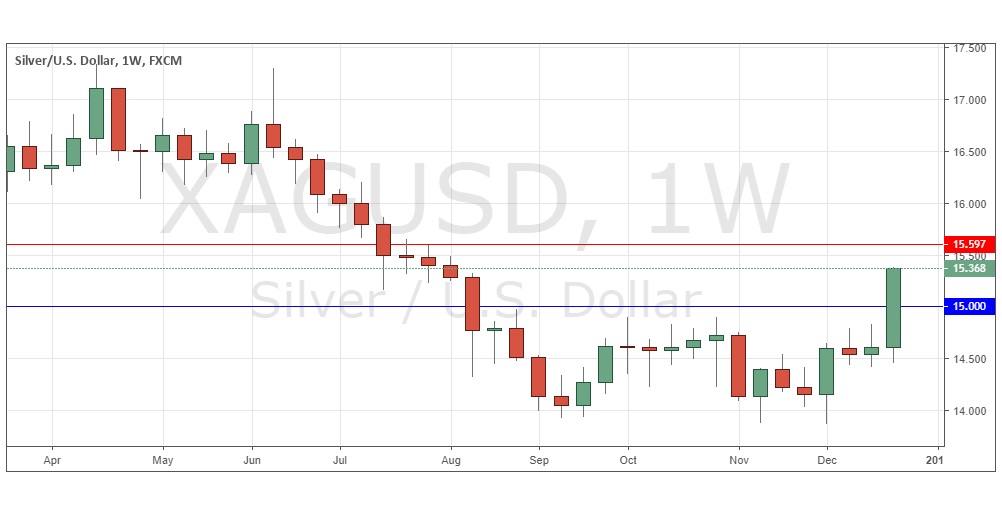
The weekly chart below shows last week produced a very large and very strong bullish candlestick. The price closed above the psychologically important $15 level and made the highest close and highest high seen in over five months. These are significant bullish signs, and the rise is helped by a flight into safe havens such as precious metals while the U.S. begins to show signs of weakening and beginning to end its long-term bullish move. However, we may expect key resistance at about $15.60.
Gold
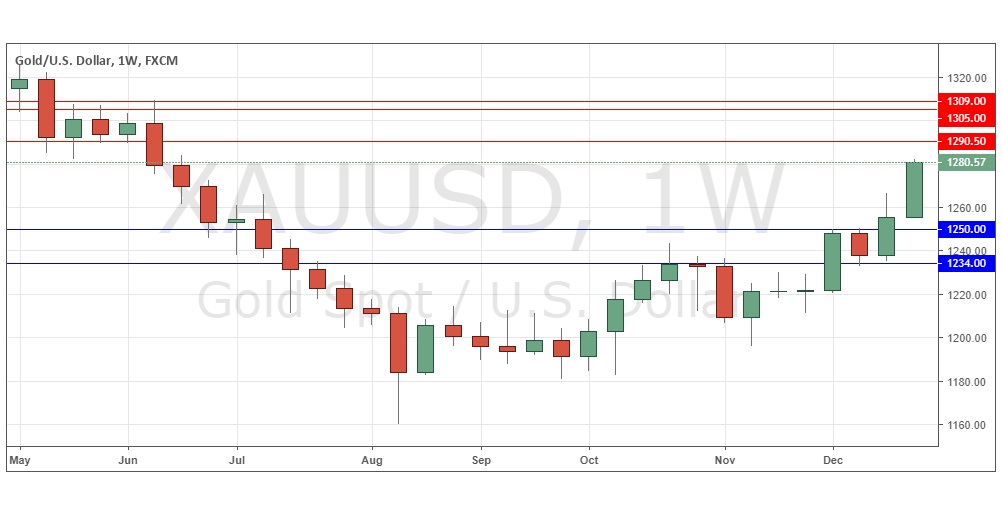
The weekly chart below shows last week produced a reasonably large and strong bullish candlestick. The price continued its rise above the psychologically important $1250 level and made the highest close and highest high seen in over six months. These are significant bullish signs, and the rise is helped by a flight into safe havens such as precious metals while the U.S. begins to show signs of weakening and beginning to end its long-term bullish move. However, we may expect key resistance at about $1290.
USD/CAD
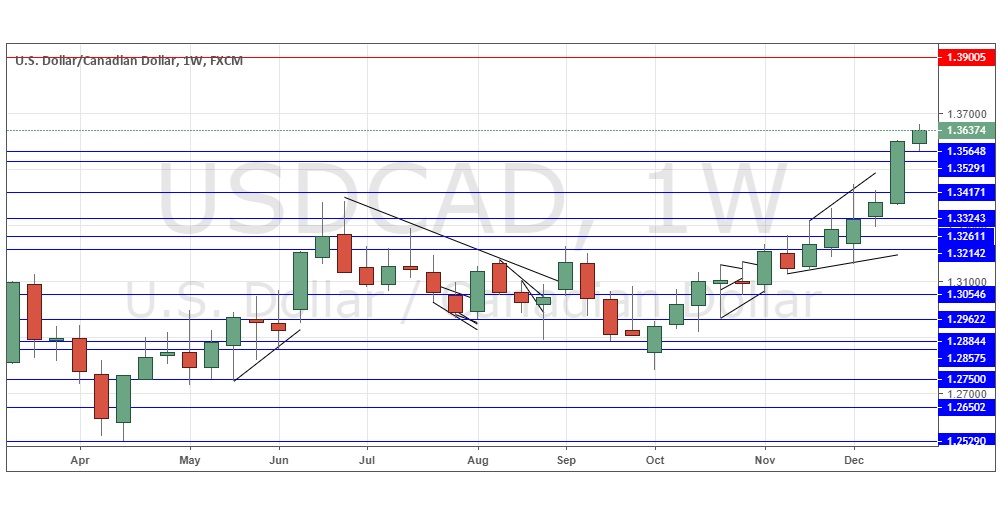
The weekly chart below shows last week produced a small but bullish candlestick, closing quite near its high. These are the highest prices seen in this Forex currency pair for more than 18 months. The price chart below shows how long-term and consistent the trend has been over most of this period, and the trend has accelerated as the price of Crude Oil has dropped sharply and beaten down the Canadian Dollar. All the signs are bullish, and the probability is that we will see still higher prices over the coming week, although there are certainly signs of a weakening in the bullish momentum.
Conclusion
Bullish on Silver and Gold, bearish on the Canadian Dollar.


