Our analysis last Wednesday ended with the following prediction:
1. It is possible to open an aggressive short trade right away.
2. A conservative short can be entered from 1.6250 upwards.
3. When a day closes below 1.6148, it is very likely that the upwards trend has ended.
4. A daily close above 1.6177 very close to the high will be a bullish sign.
5. There are support levels at 1.6029, 1.5977, 1.5954 and 1.5884.
6. It is a good idea to take profit now on any open long trades.
These forecasts worked out very well, as the price rose to a high of 1.6250 and then fell sharply, so any aggressive or conservative short trades taken as recommended would be in profit right now. It would also have been wise to take profit on any open longs. The level at 1.6029 has acted loosely as support since it was hit on Friday.
The only weakness in the forecast was seeing bullish strength in last Wednesday’s close, which was only about 15% off its daily high.
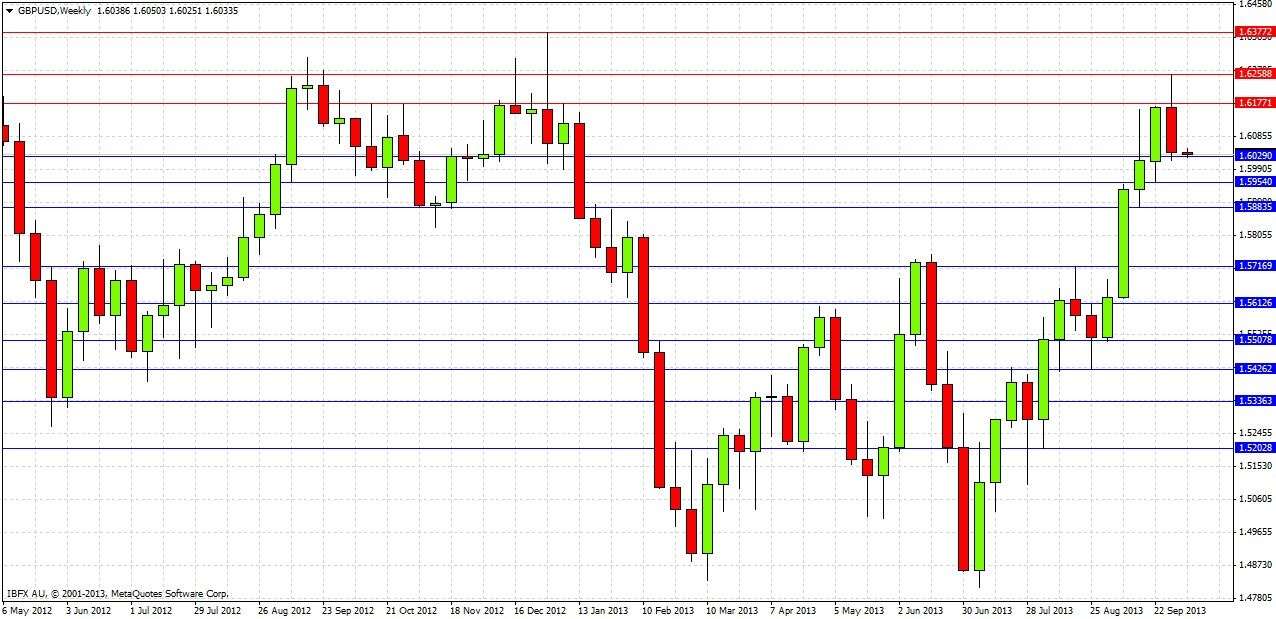
Turning to the future, let's start by taking a look at the weekly chart
Last week was bearish, closing hard on its low, with a fairly large upper wick. It is interesting to note that the week before that was unable to close above the resistance level of 1.6177. Last week’s high was just a few pips above the psychologically key resistance level of 1.6250. The resistance zone from 1.6177 to 1.6250 has survived intact so far.
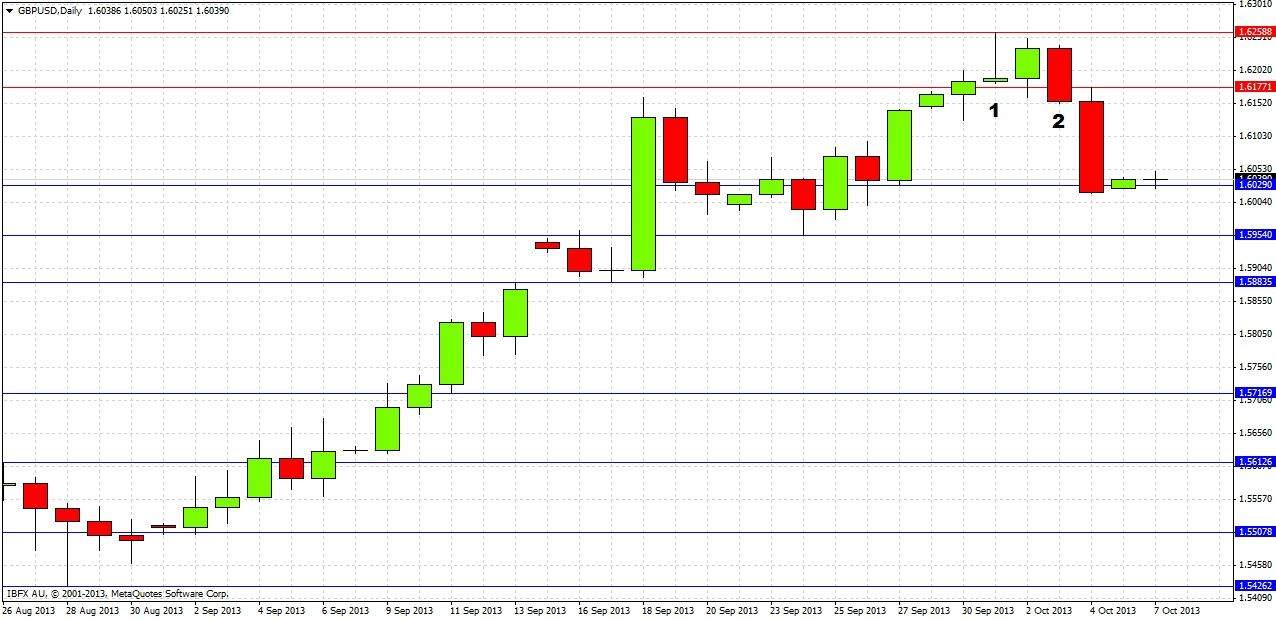
Let's drill down for some more detail by taking a look at the daily chart
The high of last week was reached by the pin bar on Tuesday (marked as 1). The next day was an up day, but could not penetrate the high of that pin bar. Thursday then made a strong bearish reversal (marked at 2), closing very hard on its low, prefiguring the sharp move down on Friday.
Overall, going back to the weekly chart, we have seen strongly bullish momentum with this pair. However we have hit a key resistance zone that over the past couple of years has always been able to turn this pair bearish.
Due to the action in recent days after hitting a key resistance zone, it would be foolish not to be cautiously bearish. The best way to monitor the wise bias will be to pay close attention to what happens should price reach the support levels below. Therefore the predictions for the coming week are as follows:
1. A daily close above 1.6177 close to the high of a daily candle will be a bullish sign. Any daily close above 1.6250 will be an extremely bullish sign.
2. A daily close below 1.5954 will be a bearish sign.
3. A daily close below 1.5884 will be a strongly bearish sign.
4. There is a good chance to get some kind of bullish bounce off the next retest of 1.5884, so there is opportunity for a long touch-trade off this level, which was resistance and has turned into support.
5. A bullish reversal on a short-term chart off 1.5954 could be a long opportunity.


