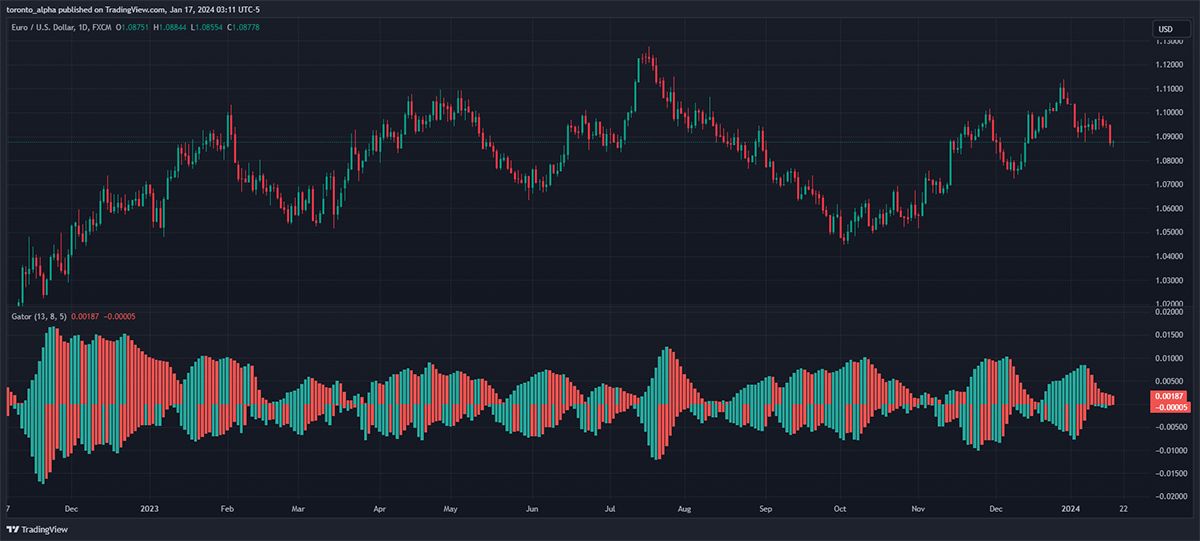
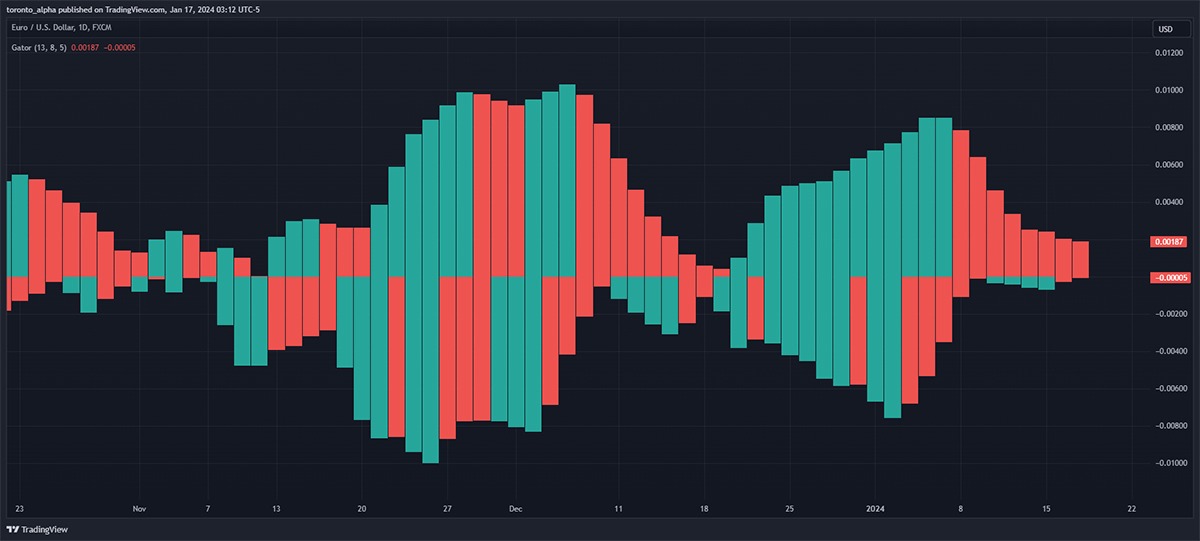
Since its creation in the 1980s, the gator oscillator has found its way into many of the world’s major trading platforms. Although well known, it has not gained the same level of popularity as oscillators such as the RSI. However, the gator oscillator has remained part of the trading landscape for decades and still has people who consider themselves fans and users.
In this article, we will explore the background of the gator oscillator, how it is constructed, and how traders can use it practically as part of their trading strategy.
Let us begin.
What is the Gator Oscillator Indicator & Trading Strategy?
Background
Bill Williams, an American trader, created a series of oscillators and other indicators in the 1980s and 90s with some of the most fun names in the world of trading: ultimate oscillator, accelerator oscillator, alligator, awesome oscillator, fractals indicator, gator oscillator, and the market facilitation index.
Mr. Williams, with a bachelor’s degree in engineering and physics and a Ph.D. in psychology, brought a unique perspective to the markets and was an early pioneer of using mathematics combining psychology in the markets. One of his early innovations was applying the mathematical concept of chaos theory to the markets, documented in his 1995 book, “Trading Chaos: Applying Expert Techniques to Maximize Your Profits.”
Williams was also an early adopter of using computers to help map his ideas of the market, even hiring programmers (a novel idea at the time for an independent trader) to help develop his tools.
He educated traders worldwide on his methods, and he has significantly influenced the field of technical analysis.
Williams designed his oscillators to be easy and quick to interpret
As Bill Williams said in 2004: “It really should not take more than thirty minutes a day to evaluate all markets, and it could only take 10-15 minutes if you can focus on the markets instead of your opinions about the markets. All you need to trade on a position basis is a few minutes at the end of the market day to place your orders for the next day.”
Gator vs. Alligator Oscillator?
The gator and alligator oscillators sound remarkably similar because they are almost identical—they perform the same function mathematically. The critical difference is how each oscillator displays its results on a chart.
The gator oscillator is a histogram. Like an MACD histogram or bars, the gator oscillator appears as a histogram underneath the asset’s price chart, comprising green and red bars indicating the instrument moves within the given timeframe.
The alligator oscillator is displayed as lines on the price chart. Three simple moving average lines (5, 8 and 13-period SMAs, then smoothed out) construct the alligator oscillator. In turn, the gator uses the alligator oscillator lines to produce its histogram.
Traders can use the gator oscillator independently of the alligator oscillator. Both indicators give the same information in different formats, and most traders will pick either the gator or alligator oscillator as their go-to indicator. That means I can have the gator oscillator on my chart without the alligator version.
The Gator Oscillator produces fewer false signals than the alligator.
This may seem contradictory if the oscillators are mathematically alike, but converting the three moving average lines of the alligator to a histogram format helps produce fewer false signals. This is like moving averages’ relationship to a MACD histogram: the MACD relies on the moving average measurement settings, but the conversion to a MACD histogram from pure moving average lines gives a more sophisticated signal.
The Gator Oscillator helps detect trend changes in an asset’s price.
Bill Willaims believed that the market only trends 15% to 30% of the time and is in ranges or non-trend moves the other 70% to 85%. Willaims believed that traders, whether institutions or individuals, tend to collect most of the profits during trends, and he designed his oscillators to capture these specific periods.
From my personal experience, I agree that the market is trending only about a third of the time, and it is where I have made most of my money.
The Gator Oscillator identifies four phases of a trend.
The gator indicator is based on the principle that trends go through four phases, like a living alligator:
- Sleeping or exhausted phase. This is when there is no trend present.
- Awakening phase: The trend is forming in this phase.
- Eating or strengthening phase: The trend is fully fledged and should be evident on the chart.
- Sated phase: The trend is running out of momentum:
The gator oscillator helps to identify the above four phases of a trend’s lifecycle and, simply put, to get in and out at the right stage of the trend cycle.
How to Read the Gator Oscillator
The gator histogram: a green and red bar for each segment. Each histogram segment has two bars, one on top of the other. Sometimes they are both green, sometimes they are both red, and sometimes they are both colours. A green bar indicates a trend stronger than the previous price action. A red bar indicates a trend weaker than the previous price action.
Note that the green and red colours do not refer to the bullishness or bearishness of the price action. The colours indicate the relative strength of the price action, not its direction.
Gator’s Sleep Phase: two red bars.
Both bars are red.
Gator’s Awakening Phase: one bar turns green.
The awakening phase follows the gator’s sleep phase and can be recognized when one of the red bars turns green. It does not matter whether the red or green bar is above or below the zero line if there is one of each.
Gator’s Eating phase: two green bars.
Both bars turn green, potentially indicating a trend move.
Gator’s Sated Phase: one bar turns red.
The sated phase follows the gator’s eating phase, which occurs when one of the green bars turns red. Again, it does not matter whether the green or red bar is above or below zero as long as there is one of each.
How to Trade with the Gator Oscillator
When using the gator oscillator:
Typically, look to enter the market during the Awakening Phase
The gator oscillator goes from two red bars to a red and green bar.
Hold it through the Eating Phase.
The gator oscillator will have both bars green.
Look to exit the position and take profit during the Sated Phase
When the gator oscillator goes from two green bars to a green and red bar, it signals the trend is nearing completion, and you should look to exit the trade.
How to Use the Gator Oscillator in Your Trading Strategy
Use the Gator Oscillator with other indicators or rules.
The gator oscillator only communicates how strong or weak a trend is. It does not convey in which direction prices are likely to move. Traders should, therefore, combine it with other complementary indicators or a set of rules to determine which direction the trend is forming.
Use it on higher timeframes.
I must write this in every article that covers an indicator, but the gator oscillator, like all indicators, is more reliable on medium to higher frames: 4-hour charts and upwards. Lower timeframes can produce more false signals.
Pros & Cons of Using the Gator Oscillator
There are potential advantages and potential risks in using the gator oscillator in your trading.
Pros
- The gator oscillator breaks down a trend into identifiable sections that clarify the decision-making process.
- The indicator is objective and easy to read, making it possible to monitor multiple markets simultaneously.
- The gator oscillator is available on most popular charting platforms.
Cons
- The gator oscillator conveys possible trade entry and take-profit areas, but it does not help the trader control risk or help determine where to place a stop-loss.
- As the gator oscillator is based on a system of moving averages, there may be a time lag (due to the indicator being naturally retrospective) between price changes and the indicator moving into its various phases.
- The gator oscillator does not indicate trend direction, just trend phase or strength. Traders should use it with other indicators or rules to ascertain the direction and make it more reliable.
Bottom Line
The gator oscillator is a unique technical trading tool, and the only one that I've seen that breaks down a trend objectively into distinct phases from where a trend does not exist (sleep phase) to when it is forming (awakening phase), the established trend (eating phase) and nearing completion on the move (sated phase). That makes it easy to apply across multiple markets. Most trading platforms have the Gator oscillator as part of their suite of indicator tools. It does require risk management and does not assist with where to place a stop-loss. The oscillator may lag and produce false signals because it is based on a moving averages system retrospective in nature.
FAQs
What is the gator oscillator indicator?
The gator oscillator indicator is a histogram containing red and green bars breaks a trend into distinct phases.
Is the alligator a good indicator?
Yes, the alligator is a good indicator because it helps identify when trends may start and end.
How do you read an alligator indicator?
For the gator oscillator, when the red bars go to green and red and then fully green, it indicates a trend has ‘’awakened” and is strengthening in momentum. The distance and crossovers between the moving average lines determine the trend for the alligator oscillator.
What is the best timeframe for the Alligator indicator?
Medium to long-term, preferably 4 hours or higher, works best to filter out market noise on smaller timeframes.
What are the disadvantages of the alligator indicator?
There is no stop-loss placement, which can lag because it is based on moving averages.
How do you use an oscillator indicator?
Oscillators can identify when trends start and finish or when the price is overbought or oversold.


