The VWAP (Volume Weighted Average Price) is an advanced technical indicator available free of charge for the MT4/MT5 trading platforms. It is plotted directly on the chart for an easy-to-read visual representation of complex math. I have taken a closer look at the VWAP Indicator available for MT4/MT5 in this article to help you decide if it is an indicator that could help you become a more profitable Forex trader.
Most veteran traders know the VWAP, which is a frequently used technical indicator for equity traders. Despite its one significant shortfall, which I will detail later, Forex traders have also started incorporating the MQL4 VWAP indicator into their trading analytics. Beginner traders may find the VWAP challenging at first, and I must stress that it is most effective for intra-day trading in Forex. Traders who use long-term strategies will not benefit as much from what the VWAP indicator has to offer.
What is the VWAP Indicator?
The VWAP indicator, as the name suggests, shows traders the average price paid for an asset, but weighted by volume. This can be a little hard to understand, so it is best to illustrate with a comparative example using the simple moving average indicator.
Simple Moving Average Example
Let us imagine that we want to analyze what has been going with the price of the EUR/USD currency pair over the past five hours as part of a process in deciding whether to make a trade or not. We open a simple moving average indicator on the hourly chart and set it to calculate a simple average of the last five hourly closing prices. If the values of these closing prices are 1.1000, 1.1010, 1.1020, 1.1030, and 1.1040, the indicator will show the average price of the last five hours as 1.1020 (the sum of each of the five values, divided by five).
Comparing VWAP and Simple Moving Average
Now let us compare that to the VWAP applied to the same asset and settings. The VWAP will read volume data showing how much EUR/USD was purchased at each of the five prices and give greater weighting to the prices where the most volume was transacted. For example, imagine that almost all the volume during these five hours was transacted at 1.1000. The VWAP will show an average price very close to 1.1000 in that case, much lower than the price shown by the simple moving average, which is only interested in price and time, with every price getting an equal weighting in the averaging calculation.
Advantages of VWAP and Application in Trading
Therefore, some traders believe the VWAP provides a more precise indicator to reflect price action. In technical analysis, volume remains a variable that tends to be very important in confirming trends, trend reversals, support, resistance, breakouts, and breakdowns. Since the VWAP uses it in its formula, I prefer using this indicator to moving averages.
VWAP Usage in Equity and Forex Markets
The VWAP indicator is most popular with equity traders because volume data for equities is available with each transaction, and many online resources provide free end-of-day volume data. In Forex, volume is more complex and usually not so readily available, given the decentralized nature of Forex trading. This can make the VWAP harder to apply in Forex, although some Forex traders believe they have found a way around this by using tick volume instead of real volume data as a volume input. While some analysts criticize this practice, there have been studies showing a positive correlation between real volume and tick volume in the Forex market. More and more Forex brokers are also making their own real volume data available to their clients, so sometimes the indicator can be plugged into this, although some may still prefer to use tick volume.
Top Forex Brokers
Why & How to Use VWAP in Trading?
VWAP (volume-weighted average price index) is a highly respected technical indicator which can reduce the noise inherent in any analysis of historical prices, thereby making forecasting future price movements easier. VWAP gives good insight into what the market really sees as the fair price over a given period, showing whether the price is trading above or below that level. In the absence of a strong trend, it can usually be assumed that the price will revert to the VWAP line. VWAP is also an effective indicator of momentum when it is present in a market, showing when it is time to stop expecting a reversion to the mean. This is indicated by a strong breakout above or breakdown below the VWAP.
VWAP works best in a longer-term analysis but can also be used effectively in short-term trading. Let’s take at a look at how VWAP is best used in each situation.
Long-Term Trading
The rise of algorithmic trading and the popularity of short-term strategies resulted in the VMAP indicator becoming one of the most popular technical indicators among retail traders. It is not well-suited for medium-to-long-term trading strategies, but here are two ways to make use of it in the higher time frames:
1. The VMAP can suggest good entry and exit levels by confirming support and resistance levels. Basically, where the VWAP shows unusually high volume, this is likely to become either a good support or resistance level. I recommend using other technical analysis tools to identify the medium or the long-term trend itself.
2. Using a moving average of the VMAP, also known as an MVMAP, gives a moving average of a moving average and can offer medium-to-long-term traders better value than a simple VWAP.
Short-Term Trading
The first thing I recommend is to adjust the settings of the VWAP indicator. The default setting displays the Daily, Weekly, and Monthly VWAP. Since you are going to be using the VWAP for short-term trading, those timeframes are not ideal. I use the MT5 platform as an example below as the VWAP is more popular with MT5 than MT4 users.
How to Apply My Recommended Settings:
1. Double-click on the VWAP indicator MT5 in your MT5 trading platform.
2. Double-click on Enable_Level_01 false. It will change to true.
3. The default for the short period is 5 time periods. Feel free to adjust it to your preference or stick with my recommendation.
4. Double-click on Enable_Level_02 false. It will change it to true.
5. The default for the long period is 13 time periods. Feel free to adjust it to your preference or stick with my recommendation.
6. Click on OK.
This is what your MT5 trading platform should look like if you followed the steps outlined above:
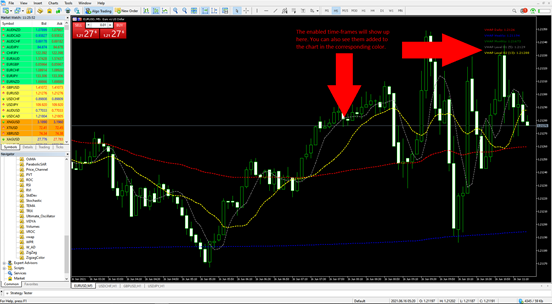
VWAP Indicator Applied to MT5 Price Chart
There are many ways to use the VWAP indicator. Most traders consider the price of an asset below the VWAP line as a discount (worth buying) and above the VWAP line as a premium (worth selling). I like to use two VWAP timeframes, in my example, the 5-period and the 13-period I apply them to the five-minute candlestick chart. Since the VWAP functions like moving averages, I look for crossovers and prefer to trade with the trend. I also find that the most accurate trading signals occur if used together with the daily VWAP as a multiple time frame analysis.
I recommend that you look for long entry signals when the VWAP 5 crosses above the VWAP 13 if price action is bouncing off support levels. I wait for the candlestick to close above both and enter my trade during a pullback. Another trade I like is a breakout above the Daily VWAP after the VWAP 5 crosses above the VWAP 13. I marked these in the chart below.
Here are a series of long trade entry signals using the VWAP indicator MT5 on a five-minute candlestick chart on the EUR/USD.
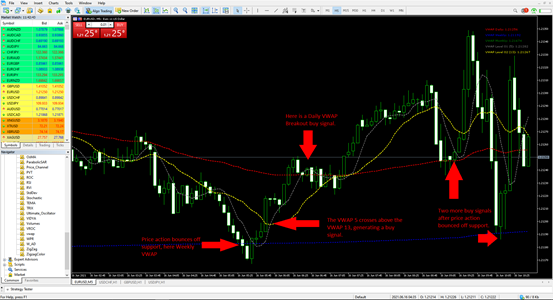
VWAP MT5 Signals
The same applies to short trade signals, just reversing the advice given for long trade entries above.
What is the VWAP Indicator Strategy
The VWAP indicator strategy starts with comparing the current market price of something to its volume-weighted average price over a defined look-back period. The comparison can be used to identify whether there is a good buying or selling opportunity at the currency price.
- VWAP can be calculated manually but there is no need for this as most trading platforms include an automated version of the indicator which is graphically represented on the price chart in an easy-to-use manner.
- The relationship of the price to the VWAP can be established at a glance.
- The VWAP’s upper and lower lines as they relate to the price can indicate whether overbought or oversold conditions may exist – these lines represent a standard deviation from the VWAP.
If the central VWAP line is strongly and consistently rising, it indicates that a bullish trend strategy should be adopted and that the trader should look for buying opportunities. If the price is firmly above the VWAP, this is usually considered a good price to buy at, but some traders will look to buy on any dips below the VWAP when it is angled upwards – in Forex, this kind of dip buying in a strong trend can often work well.
The opposites hold true when the VWAP is strongly and consistently falling, regarding selling opportunities.
Some traders like to use other technical indicators to confirm signals from the VWAP indicator strategy, especially the Relative Strength Index (RSI) or Moving Average Convergence Divergence (MACD) indicators.
Pros & Cons of Using the VWAP Strategy
Like any trading strategy, using the VWAP indicator strategy has both pros and cons.
Pros:
- The VWAP indicator is used by large institutions as a basis for their very large-scale trading activities. Trading along with the VWAP can be a way to follow the big money, which can be a very effective trading strategy itself.
- Since the VWAP indicator is calculated from both price and volume data, it can provide a more honest representation of a security's true price trend than a simple moving average. It is a more sophisticated indicator.
Cons:
- The VWAP indicator strategy typically does not work well in very volatile markets, especially one that sees radical changes in volumes traded.
- The VWAP indicator is a lagging indicator, meaning its signals may tend to be generated at a time when they are already too late to be very accurate and useful.
- The VWAP indicator tends to be less suitable for very short-term or very long-term trading. It generally tends to work better on higher time frames like the daily, but perhaps not on the very high time frames like the weekly or monthly.
What is Anchored VWAP?
Anchored VWAP is calculated from a specific past “anchor” event, unlike the standard VWAP which is just calculated over a past period. Anchor events used are typically a major price swing, a major change in trading volume, or an important news event.
Many traders consider an anchored VWAP to be a superior indicator to the standard VWAP. This is a very difficult question to answer though, as much will depend upon the anchor event chosen, which is discretionary by nature. However, the concept of using an obvious change of market regime as an anchor is logical, considering that using the same look-back period all the time is relatively arbitrary.
What is VWAP vs TWAP?
TWAP standard for time-weighted average price. TWAP calculates the average price of a security over a specific period based on time alone, ignoring volume, unlike VWAP.
The formula for TWAP = ∑(Price * Time) / ∑Time
TWAP is typically used to assess the performance of algorithms over the long term, or to provide a long-term average price, whereas VWAP is more typically used as a trading indicator to determine when to buy or sell.
What is VWAP vs VWMA?
VWMA stands for volume-weighted moving average. It is a moving average indicator which calculates the average price weighted by volume. The VWMA will react more quickly to changes in trading volume than a simple moving average, which will have no volume weighting.
The formula for VWMA = ∑(Price * Volume) / ∑Volume
VWMA is typically used in a similar way to VWAP, to identify trend and momentum, which it arguably does better than VWAP. VWAP is likely to be more accurate at identifying the true average price.
Differences Between the VWAP Indicator in MT4 and MT5
Since the VWAP indicator belongs to a newer generation of technical analysis tools, most traders use it on the MT5 trading platform. I found only two free versions for MT4, one being the MVMAP, but these will provide valuable indicative data for free. The one you will see in most screenshots in articles on the topic is the VWAP Indicator MT5. I will show you below how to get either one free of charge.
The below screenshot shows the free MVWAP for the MT4 trading platform.
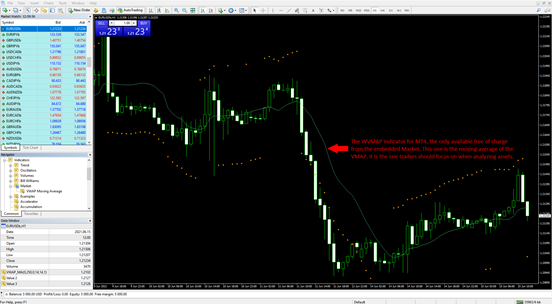
MVWAP for MT4
Unfortunately, finding a free VWAP for MT4 required a lot of digging through posts and forums. I did manage to locate one and will share the details in the next section.
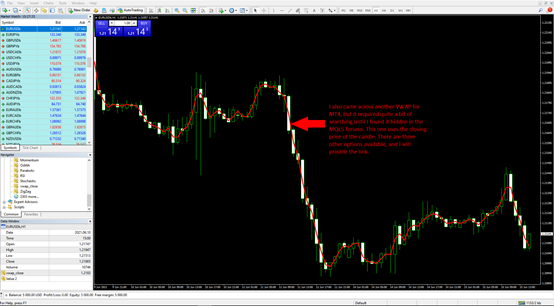
VWAP for MT5 – Closing Price
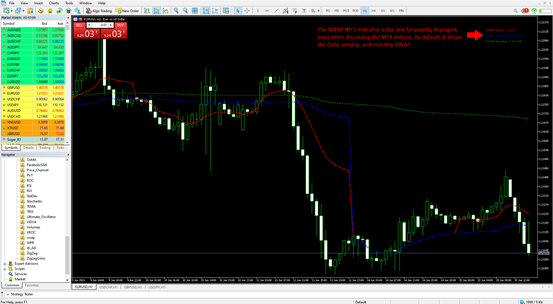
VWAP for MT5 – Display
How to Download and Install VWAP Indicator for MT4
I found two publicly available options which both work fine. The best place to get any add-ons for MT4 or MT5 is directly from the trading platform itself.
Here is how to get the VWAP MT4 indicator:
1. Open your MT4 trading platform.
2. Navigate to Market.
3. Type VWAP in the search box located in the top right-hand corner of the Market tab.
As you can see in this screenshot, only the VWAP Moving Average, also known as the MVWAP, is available free of charge.
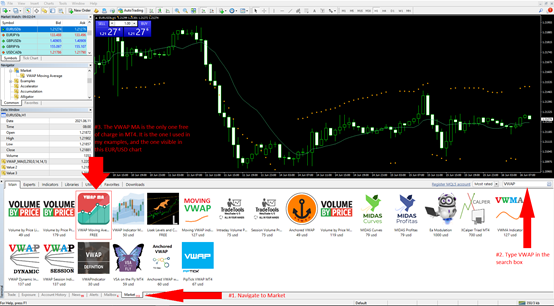
Free VWAP Moving Average Indicator for MT4
You can search the official MQL5 website here. Do not be confused by the name, as it is for MT4/MT5. I do not recommend that you pay for any VWAP Forex indicator, and I will show you a free alternative for the VWAP MT4 indicator in the next step.
A lot of traders ask for the VWAP indicator MT4, but it is not easy to find. After combing through forum posts and running an in-depth search, I came across one that is free of charge, works as intended, and is the one you can use. I found it buried in an MQL5 forum help call, which you can access here.
In the post, scroll down a bit to the section I have highlighted. There are four versions of the MQL4 VWAP indicator.
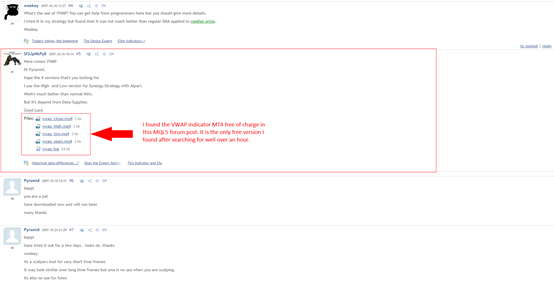
Free VWAP Download in MQL5 Forum
I used the VWAP Close in my example, as I generally base my analysis on the close of a candlestick.
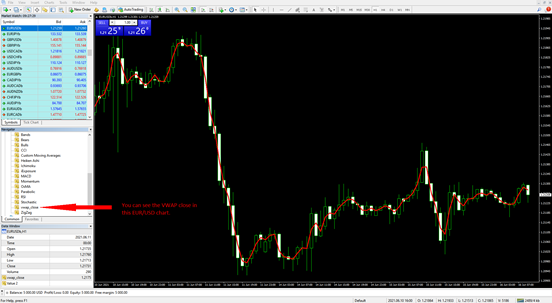
VWAP Indicator Set to Closing Prices
How to install the VWAP indicator from the MT4 Market:
1. Click on the VWAP Moving Average Icon.
2. Click on Download and wait for it to finish.
3. Navigate to the MT4 Navigator. You can also access it with the shortcut CTRL + N.
4. Expand Market within the Navigator.
5. Double-click on VWAP Moving Average.
Installing items from the MT4 Market is a simple process. It should take just a few seconds, depending on your internet connection speed.
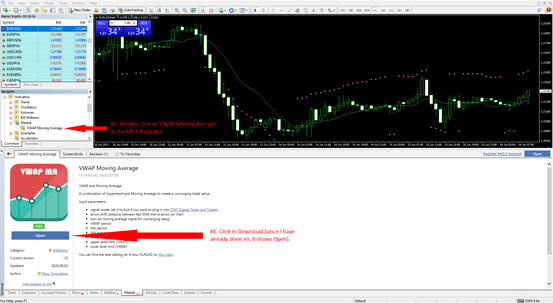
VWAP Moving Average Indicator Installation MT4
The installation from a downloaded file appears more complicated but remains simple. Please note that sometimes the files come as a zipped folder, so you must unzip them before proceeding. This not the case with the VWAP indicator MT4 discussed earlier in this article.
How to install the VWAP indicator MT4 from Downloads:
1. Download the VWAP Forex indicator MT4 here.
2. In your MT4 trading platform, click on File located in the top menu.
3. Click on Open Data Folder.
4. Double-click on MQL4.
5. Double-click on Indicators.
6. Copy-paste the downloaded VWAP indicator from step #1 into this folder.
7. Restart your MT4 trading platform.
8. Navigate to the MT4 Navigator. You can also access it with the shortcut CTRL + N.
9. Scroll down to vwap_close if you used this version and double-click on it.
10. You can adjust the settings and the visual representation in the pop-up.
11. Click on OK.
Double-clicking on any desired indicator will result in a pop-up with settings and visualization options. Clicking on OK will add it to the chart.
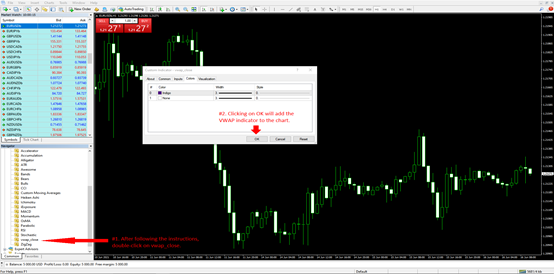
VWAP Moving Average Indicator Installation MT4 – Final Stage
Here is how to download and install the VWAP indicator MT5:
1. Download the VWAP indicator MT5 from here.
2. In your MT5 trading platform, click on File located in the top menu.
3. Click on Open Data Folder.
4. Double-click on MQL5.
5. Double-click on Indicators.
6. Copy-paste the downloaded VWAP indicator from step #1 into this folder.
7. Restart your MT5 trading platform.
8. Navigate to the MT5 Navigator. You can also access it with the shortcut CTRL + N.
9. Scroll down to vwap and double-click on it.
10. You can adjust the settings and the visual representation in the pop-up.
11. Click on OK.
Here is the VWAP Indicator MT5, the default version typically used in discussions of the indicator:
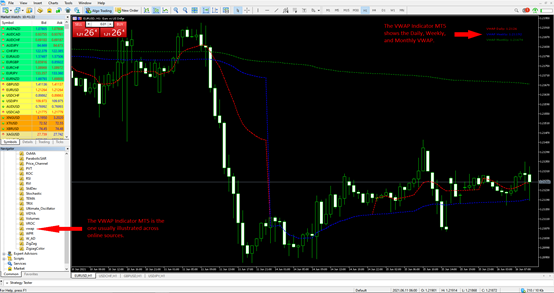
VWAP Moving Average Indicator in MT5
How is VWAP Calculated?
This is not essential information, so feel free to skip this section if you are not interested in learning exactly how the VWAP indicator values are calculated.
The formula is straightforward:
(TP x Volume) / Volume
TP stands for typical price and the formula is:

The TP for each period multiplied by the volume results in the TPV. Keeping a running total of the TPV, also known as cumulative TPV, by adding the following values to existing ones generates the next data points to plot. Finally, the TPV divided by the cumulative volume used in the calculation results in the VWAP.
It may sound a bit complex, but the free VWAP indicator does all the math, leaving traders with the lines, like how moving averages appear on charts. I always recommend that traders understand the calculations, which allows them to comprehend what they see.
I like the VWAP and use it in my technical analysis, as it gives me a more precise understanding of price action. At the same time, I want to warn traders that using the VWAP by itself does not generate accurate trading signals. It is not that simple, but it can be useful to bring volume into the analytical equation.
Bottom Line
I prefer the VWAP over traditional moving averages because it weights price by volume, which I believe is one of the most definitive and useful technical parameters that can be utilized in a successful trading strategy. However, the VWAP is not a holy grail. Traders must understand what the VWAP tells them and learn how to use it together with other aspects of technical analysis. I caution against any trading strategy that relies entirely on signals from one source, so if you use the VWAP indicator, you should be looking at least one different type of indicator as well.
