What Does Price Action Mean?
Price action in trading refers to the movement of a market’s price plotted over a significant amount of time. Price action forms the basis of all technical analysis, regardless of the market in which it is found. Technical analysis is best thought of as an offshoot of price action, although it will often include other aspects of analysis such as indicators like the MACD, Bollinger Bands, moving averages, etc.
Often, traders will look to specific types of candlesticks or chart patterns to derive where the market is most likely to go, or at times, where it will refuse to go. At that point, they then can make trading decisions, including entry signals, stop loss orders, and potential profit targets.
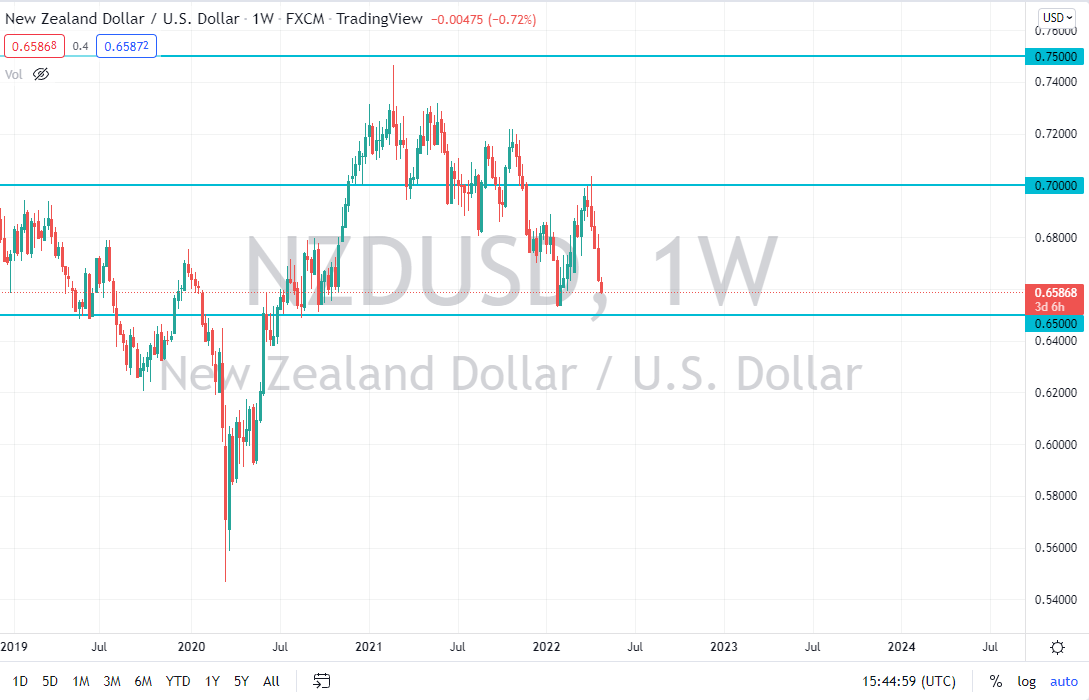
When using price action in trading, traders will look at a variety of factors. The first one will be following the sequence of highs and lows to map out where the trend is leading. If there is a consistent action of forming higher highs and higher lows, traders will look at that as an uptrend. If there is a consistent action of forming lower highs and lower lows, then traders will look at that as a downtrend.
Plotting out support and resistance, or where the market finds buyers and sellers over time (demand and supply) is another important input when it comes to price action in trading. Traders will look for patterns and particular candlesticks as signals to get involved in the market.
The best way to look at price action in trading is that sometimes the market whispers what it wants to do, and sometimes it screams what it wants to do. It is the job of the trader to read the charts to try to determine whether traders will be buying or selling, based on historical price movements.
Does Price Action in Trading Really Work?
Yes, over time reading price action can be very profitable. However, you must understand that nothing works 100% of the time, and the big mistake that most traders make is when they believe that a trade “cannot miss.” This typically will lead to emotional trading if the trade does not work out, and therefore people make poor decisions at that point.
Understand that trading is a game of probabilities, and that using price action can put those probabilities in your favor. However, it is how you react to failures that often will determine your profitability over the longer term.
Price action gives traders a view of where the market is trying to get to, or perhaps where it will not go. At that point, then traders can make an educated decision as to any position they wish to put on.
How Do You Trade on Price Action?
While in theory, you could trade every potential support or resistance candlestick, most traders will determine what they are most comfortable with and stick to a handful of setups. For example, if you find the hammer and shooting star candlesticks to be particularly interesting and profitable, you may choose to just trade on those candlesticks when they set up.
Other traders may find flags in the direction of a trend as their favorite pattern. The most important thing is that before you get involved in any setup, you understand the typical probability of those setups working. Some are more likely to produce profits than others, so you must back test with historical price data to understand how each one of these potential trading setups should perform over the longer term.
With a large enough sample, say two hundred theoretical trades, you should have an idea of the typical percentage of wins versus losses. You would also do well to understand the potential distance that a market may typically move after forming whatever setups you choose to use. These setups should also have a clear-cut signal determining when you will exit the trade. Keeping statistics on the outcomes of the entries you identify as you trade them will give you longer-term confidence that will allow you to trade every time one of these patterns or candlesticks meets your criteria.
What are Price Action Trading Rules?
Price action in trading demands that you use rules. For example, if you choose to only trade hammers and shooting stars, you do not necessarily want to take every single one that appears. You might add helpful variables that will help you along the way and can greatly improve your results. This is what is known as “system optimization.”
One example in such a strategy might be that you only trade hammers or shooting stars at either support or resistance. It could include only trading with the overall trend, based upon the movement over the last year or so. Some traders might want to also see the price the right side of a key moving average or two on top of that.
An example might be something like this:
- Trade only hammers or shooting stars.
- Look for “large round numbers” to trade from. This would include numbers such as 1.30, $15.00, $10.00, 2.00, etc. Some traders also use “midcentury marks,” which would be increments of 50.
- Trade only in the same direction of the last month or more.
- Place a stop-loss order underneath or above the candlestick in question.
- Target the next “big figure” (round number).
In a situation like this, you have clearly laid out rules, and if this situation appears, you should know exactly how to trade every time it shows up on your preferred timeframe.

Price Action Trading Strategies
While there are endless possibilities for trading strategies, I will look at two very common ones that price action traders tend to use. The first one is based upon simply trading shooting stars and hammers, while the second one will be based upon impulsive candlesticks.
Shooting Star and Hammer Trading
The shooting star and hammer candlesticks are well-known, and therefore there is a bit of a “self-fulfilling prophecy” when you see them. This is a good thing, because not only does the candlestick suggest that the market is failing to move in a particular direction, but everybody else is seeing the same thing.
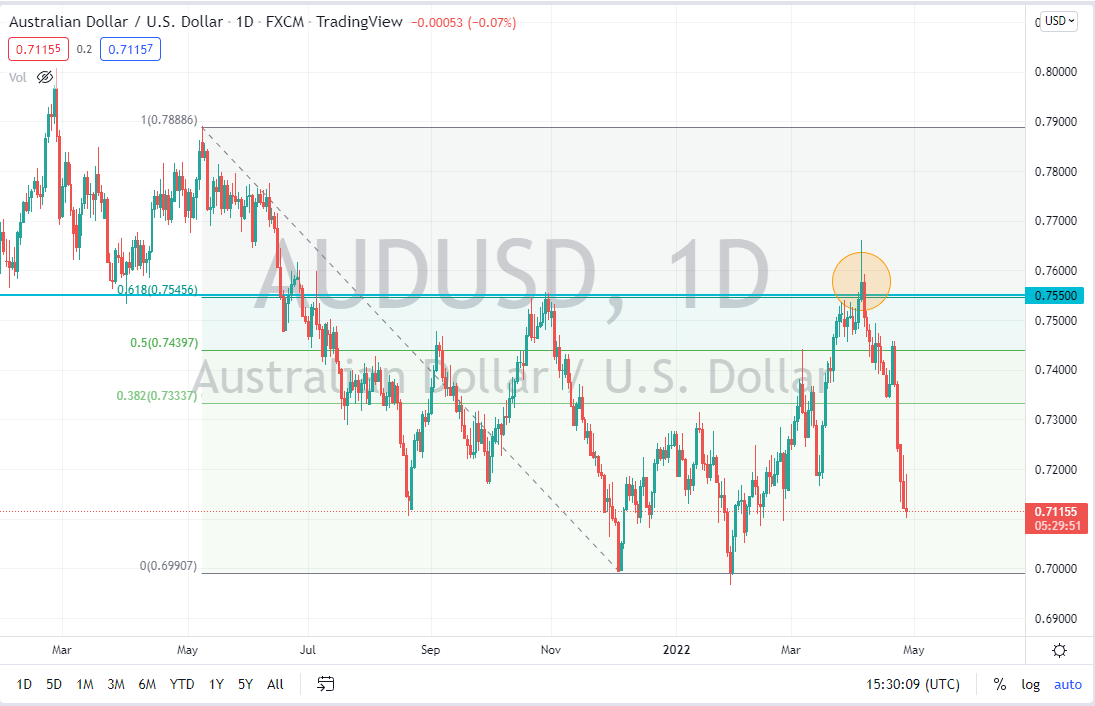
When you add supporting resistance, and perhaps even a Fibonacci retracement level, then you have a formula for a potential trade. Notice on the chart below I have marked a shooting star on the AUD/USD Forex pair with a circular highlight. Notice that it is at the 61.8% Fibonacci retracement level from the massive move lower, and that is an area where we have already seen the price fall from. The candlestick that is circled started a massive move toward the bottom of the Fibonacci retracement tool.
In essence, you are looking for places where the price has failed to break above or below and take advantage of the “market memory” in that area.
Look for a shooting star or hammer.
Check to see if a Fibonacci retracement level lines up.
Look for previous support or resistance.
Check to see if the price level is a whole number or a “50 level.”
Play stop loss on the other side of the trigger candlestick.

Impulsive Candlestick Trading
Another simple price action strategy is looking to take advantage of an impulsive candlestick. While there is a certain amount of flexibility in defining what an impulsive candlestick is, I look at it as a candlestick that is much bigger than any of the preceding three candlesticks. This shows that there is an impulsive move in one direction or the other, and therefore momentum is increasing.
As with all things related to technical analysis, you need to pay close attention to support and resistance. Where impulsive candlesticks can become particularly interesting and profitable is when you see support or resistance level broken by a long candlestick. Placing a stop loss either above or below the previous support or resistance sets up a trade that can potentially run quite a distance.
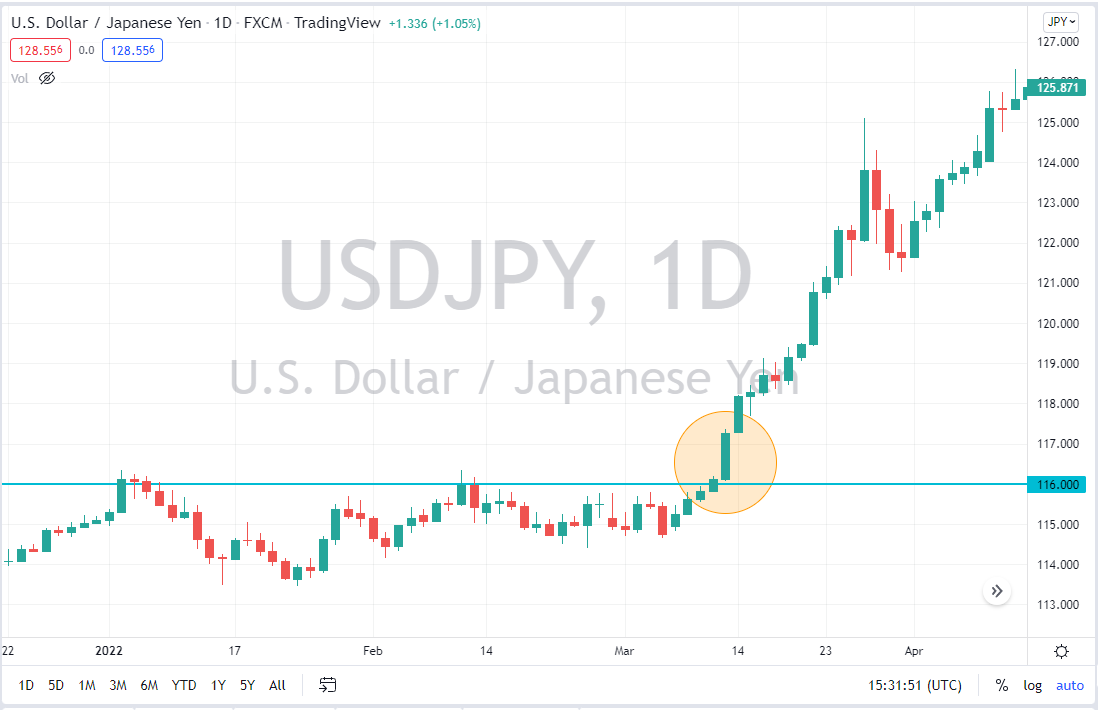
In the below price chart, you can see that the USD/JPY pair had been struggling to break above the ¥116 level. However, on March 11, 2022, the market made a bullish breakout and formed a much larger candlestick than we had seen during the previous several weeks. This was a clear sign that momentum was picking up and kicking off a major move higher.

Summary of the impulsive candlestick price action trading strategy:
Identify a potentially impulsive candlestick.
Determine whether it is bigger than the previous three candlesticks.
Look for support or resistance.
Take trade in the same direction of the candlestick with a stop loss below or above it.
Price Action Trading Tools
There are quite a few tools that traders will use to trade price action. For example, they will use support and resistance lines on the chart, which can be considered as “signposts” on a highway. These can give you an idea as to where larger amounts of money may be entering or exiting the market, and therefore if you get it right, it can be a crucial improvement to you trading.
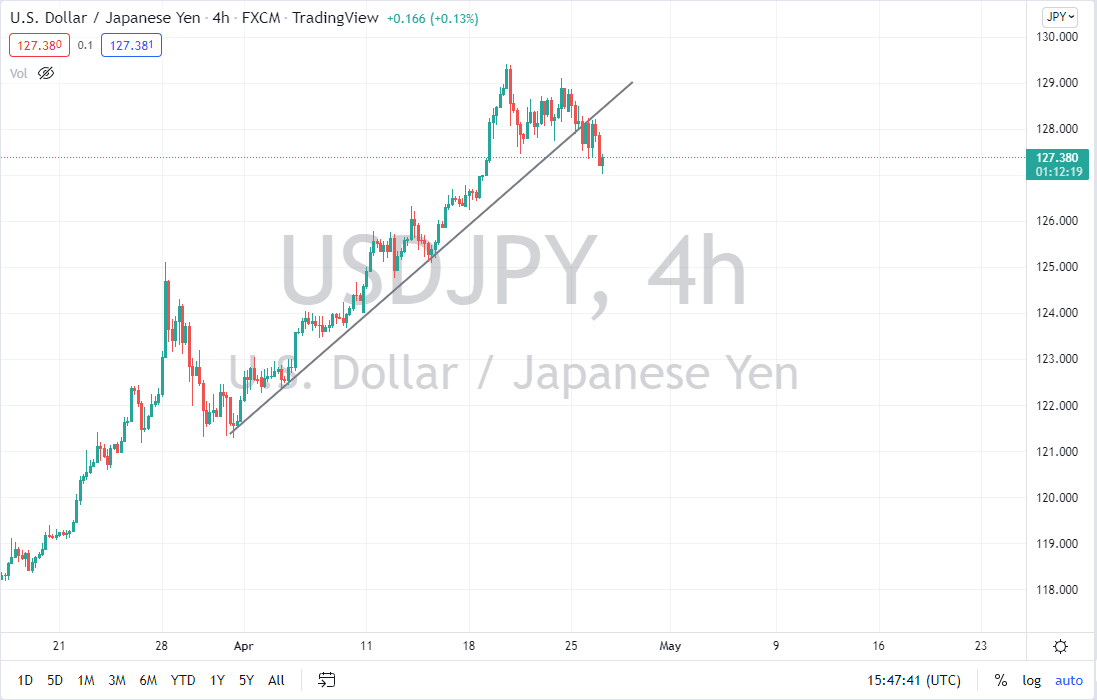
A trend line is also a major tool a lot of traders will use, as over the longer-term traders tend to pay close attention to them. Furthermore, when price breaks through those trendlines, this can be a clue as well. Channels are also used quite often as tools by price action traders, as they can give you a “heads up” as to the top or bottom of the likely price range going forward.

Final Thoughts
In the final analysis, when traders talk of “price action”, they usually mean a trading strategy which is based upon reading candlestick chart patterns and individual candlesticks. If no other inputs are used in such a trading strategy, it is called “pure price action.” I argue that price action trading works even better when it is “impure,” and combined with support and resistance studies, by horizontal lines on the price chart which have previously functioned as both support and resistance, and by mobile support and resistances such as trend lines, price channels, and key moving averages.
However, learning to apply these studies correctly, or at least correctly enough to be profitable, is something that takes practice for most traders. For this reason, if you do not feel comfortable with any of these indicators or studies, do not use them. In fact, you can get by fine just adding horizontal support and resistance levels, so this is probably the most useful thing to learn once you have mastered the major Forex price action candlestick chart patterns.
Moving averages are not so vital as mobile support and resistance, in fact that can be very haphazard. Moving averages are better used as crossover signals to give your trading a trend filter. For example, a typical filter would be only taking long trade if the 50-period moving average is above the 200-period moving averages. This makes sure you only enter trades in the direction of the long-term trend, at least in the timeframe you are trading. If you are also drawing support and resistance, you can make sure you are trading in the line of least resistance as well, which should improve your results over the long term.
Be aware that price action works much better and is easier to interpret on higher time frames such as the daily chart.
FAQs
What does price action in trading mean?
Price action in trading refers to the movement of price, which forms the basis of all technical analysis. Price action can encompass candlestick shapes, candlestick patterns, and simple trend analysis.
Does price action in trading really work?
Yes, price action in trading does work over the long term. The markets are based upon probabilities and not certainties, so one cannot simply suggest that every time a setup comes along, it will automatically be profitable. However, there are price action setups that generally swing the odds to your favor.
Is price action better than indicators?
Each trader will be different and therefore may read charts and indicators differently. It should be noted that there is no reason you cannot profitably combine price action analysis with indicator analysis.
Why do price action traders fail?
Poor money management, a lack of discipline in sticking to the system, and a simple lack of ability can all come into the picture.
