What is Technical Analysis and Why Is It Important?
Technical analysis is a form of analysis that is used to evaluate markets and identify the opportunity for placing trades based upon historical prices, statistical trends, trading activity, price movement, and in some markets, volume. Technical analysis focuses solely on price action, or how an asset moves.
Technical analysis contrasts sharply with fundamental analysis, which will consider economic factors such as national growth, interest rates, and political factors. There are also other types of analysis such as sentiment analysis, but those are quite a bit more esoteric and difficult to define. In sentiment analysis, an analyst is trying to guess how other traders “feel” about a currency or an economy.
Technical analysis is essentially quantitative and is popular for that reason. For example, if momentum indicators are showing that the price is rising with strong bullish momentum on multiple time frames, a technical trader will see it as a clear signal to go long. Technical traders find they can get just as good results trading the price as they can spending many hours wading through the details of the fundamental data behind two currencies’ economies, and much more quickly.
Technical analysis gives you the ability to define when you should enter and exit a trade. It gives you the “what, where, when” when it comes to a particular trade, but not necessarily the “why?”
Technical analysis is important because it is arguably the most effective, and certainly the most popular, tool in widespread use, specifically among Forex traders, and most especially of all, short-term traders. It is a branch of analysis that every trader should be familiar with.
You can make money in Forex without fundamental analysis, but you will be very lucky to make any consistent profit with fundamental analysis alone.
What are the Main Types of Technical Analysis In Forex?
There are two major types of Forex technical analysis that traders use:
Candlestick patterns or chart patterns (subjective)
Technical indicators / statistical indicators (objective)
Technical and statistical indicators produce mathematical signals from their formulas which are applied to historical prices and sometimes volume to indicate the state of the market in that asset. Such indicators can measure overbought or oversold conditions, relative strength, and the potential for price to continue in the same direction or reverse. There are literally hundreds of price indicators available, with the MACD, moving averages, RSI, and Bollinger Bands being some of the most popular. Many traders, especially beginners, become overly worried about which indicator(s) to use, but the truth is that all these hundreds of indicators could be grouped into maybe four or five distinct types, and all within the same category will give very similar results. It makes sense to be aware of the major indicators, what they indicate, and what the strengths and weaknesses of each are.
Regardless of what type of technical analysis you choose to use, it is most likely than you will find yourself using some combination of candlestick or chart patterns and technical indicators.
Applying Technical Analysis
The most important and fruitful goal you can achieve through using technical analysis is determining whether a market is trending or ranging over the long term.
Once you have determined this, you can start to look for “value” trade entry points in a Forex currency pair as it will inevitably pull back and retrace against its trend from time to time. Some traders prefer to look for breakouts. It is also very important to be aware of areas of potential support and resistance where the price will be more likely than usual to make a reversal, and technical analysis is the way to determine these price areas.
Below I examine three of the most popular technical analysis methods and explain how you can best use them.
Bollinger Bands
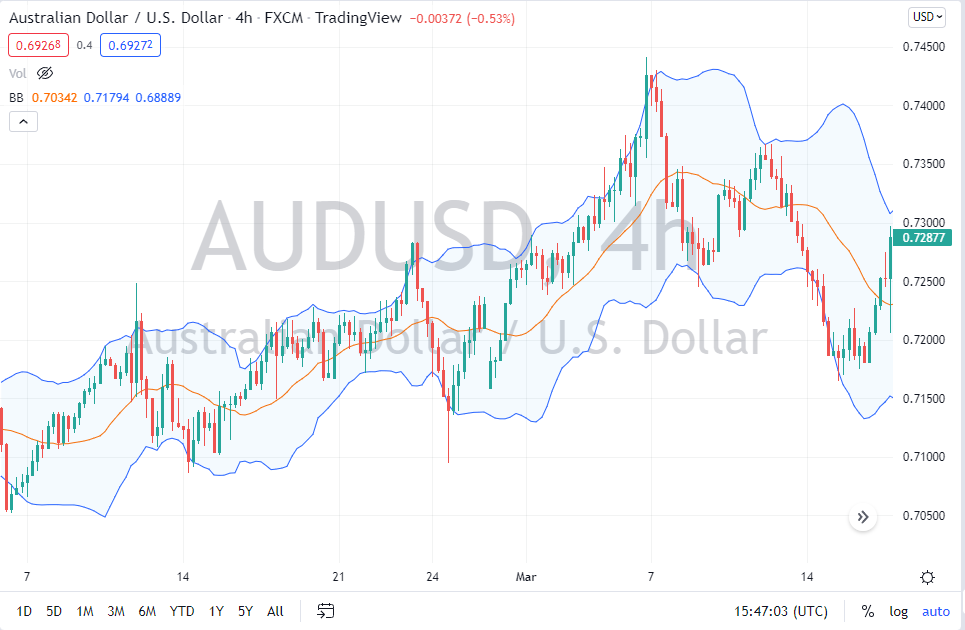
The Bollinger Band is an indicator which measures standard deviation. In a typical set of historical price data, 95% of all the prices will fall within two standard deviations of the mean (average). In this case, the “mean” is measured using a 20-period simple moving average. On each side of the indicator, you have a measurement of two standard deviations, shown by the bands – this is the indicator’s default setting, which can be changed. Once the price breaks out above or below the outer bands shown by the indicator, it indicates an overbought or oversold condition in the market, or a strong trend. The width of the bands expands and contracts in line with the historical volatility during the indicator’s look-back period.While there are a multitude of ways that traders will use Bollinger Bands, the simplest way is to buy or sell if a candlestick breaks out of the bands, expecting the price to return to the mean which is shown by the center line within the bands. There is also something known as a “Bollinger Band squeeze,” which is when the bands narrow and become relatively horizontal, suggesting that pressure is building up for an explosive breakout. The “Bollinger Band squeeze” is one of the more popular technical analysis trade entry signals used by Forex traders.

Forex Candlestick Patterns
Candlestick patterns are a common way to approach technical analysis. Simply put, they are chart patterns made up of several individual Japanese candlesticks which are widely followed by traders around the world. There are hundreds of candlestick patterns possible, but in practice, there are only about twenty particularly important ones which traders are generally looking for.
When you can identify a candlestick pattern on the chart, it tells you whether the price is more likely to rise or fall over the short term or continue to trade sideways.
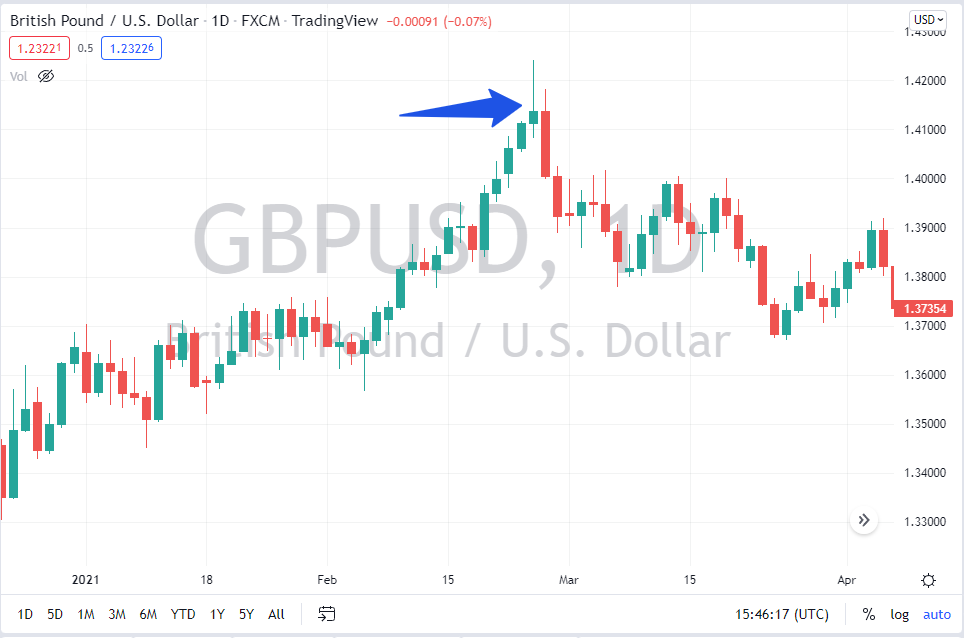
A long wick on the most recent candlestick in the direction of greater momentum is usually seen to show that there is a lack of momentum in the price. In the price chart shown below, there is a blue arrow pointing to a “shooting star,” which is a bearish candlestick which indicated that the market was unlikely to hang on to most of the gains it had just made. As you can see, shortly after that highlighted candlestick, the price of the asset fell quite hard.

Keep in mind that there are both bearish and bullish candlestick patterns, and for that matter, there are neutral individual candlesticks. Each candlestick gives you some information that you can act upon, although not all candlesticks are equally important. The place on the chart where these candlesticks appear can make a dramatic difference to their importance, as nearby support or resistance could work either in favor or against the indicated move.
Forex Chart Patterns
For most traders, a Forex technical analysis strategy will involve looking for some type or types of chart patterns. Chart patterns are a collection of individual candlesticks or price bars that make up a larger pattern. For instance, you may have 6 candlesticks that end up forming a rectangle (indicating consolidation) or 13 candlesticks that form a bearish “head and shoulders” pattern (indicating a downwards price movement is likely).
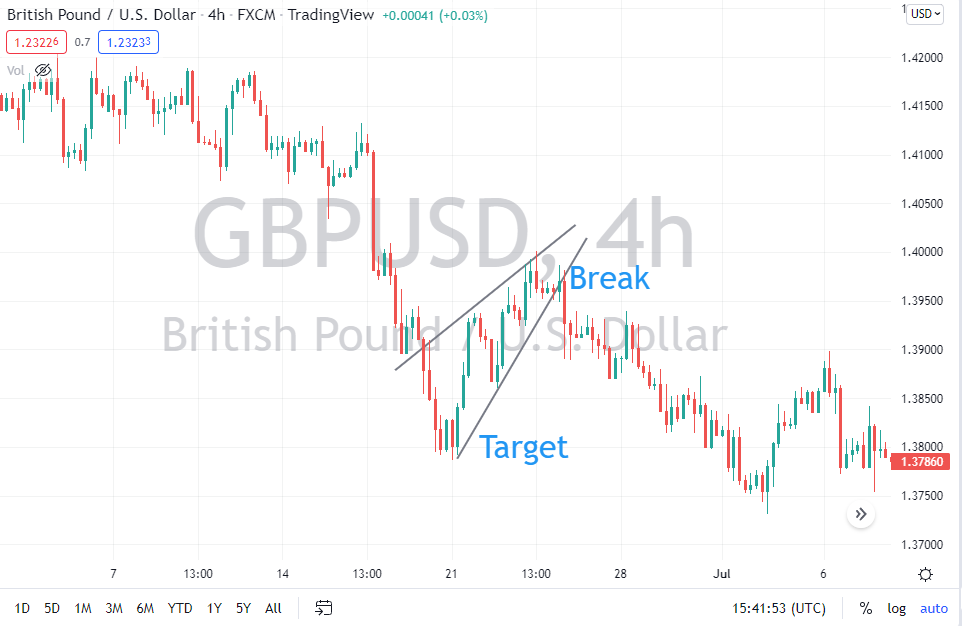
Most chart patterns, when identified, produce specific trade entry and stop loss points, and some even imply a projected take profit order target based on the size of the pattern. One of the most common Forex chart patterns is the “wedge”, which forms when price volatility compresses, possibly indicating an imminent trend change due to fading directional momentum. In the price chart shown below, there is an example of a wedge that has broken. This is one of the candlestick patterns that implies a projected target, as breaking through the trendline of the wedge traditionally suggests that the market will return to the beginning of the wedge.

Note how the wedge had been rising before breaking down. This formation is known as a “rising wedge,” which is bearish. This is because we are running out of momentum in a move to the upside. The opposite type of wedge pattern is the bullish “falling wedge.”
How Can You Best Use Technical Analysis?
The biggest win you can get from technical analysis is to understand which direction a market is more likely to move in over the longer term. Yes, anything can happen on any given trade, but generally, if you follow trends driven by big money in the markets, you have a much better chance of success.
Another big advantage of technical analysis is that it can give you a very strictly objective way of identifying trade entry opportunities.
For example, you may be reading in the news that the next coffee crop looks like a big failure due to harsh weather affecting harvests, so you would be expecting the price of coffee to rise due to the restriction of supply. However, if you have a rule derived from technical analysis such as not going long until the price makes a new 50-day high, this could stop you getting into such a trade too early. There could be several good reasons why the price of coffee is bound to go higher but does not. In this way, technical analysis can keep you out of a trade until the price is starting to do what you expect it to do. Technical analysis can help keep you more focused on where the market is going, and not where you or others think it is going.
Conducting technical analysis as weekend analysis can be extremely helpful because it allows you to zoom out and focus on the “big picture” at a time when most markets are closed. By understanding before the markets open for the week where prices may go, you can be prepared to make much better decisions when crucial moments arrive.
How to Find the Best Forex Trading Systems and Strategies
You can find the details of many trading systems and strategies on the internet. Most of these strategies are based on technical analysis and give clear rules for trade entries and exits. It pays to be skeptical about how good these strategies are, and if you pay attention, you will see that very few pieces about specific trading strategies include a back test result showing how the strategy performed over recent years. A trading strategy might look good and seem appealing, but if it lost money every year for the last five years, should you really be using it?
Another big mistake that is common for new traders to make is to be looking for the “holy grail”, meaning a perfect strategy that is guaranteed to make money. The “holy grail” does not exist as a specific strategy, but there are well-proven edges (such as trading in line with the long-term trend) that are likely to make you money over the long-term if you execute them correctly.
Another similar mistake is worrying too much about the exact parameters of a trading strategy. For example, if a trading strategy is based mainly upon a moving average crossover, don’t waste too much time wondering if its better to use a 19-period EMA or a 21-period SMA or a 22-period smoothed moving average. The exact parameters matter less than having defined parameters that make broad sense and sticking to them.
The best way to find the best Forex trading strategies is:
Search for trading strategies and styles on the internet and read them. Find two or three that sound appealing. Back test them over the past 5 years on major Forex currency pairs and see how they would have performed.
Understand that all strategies are either following trends or expecting reversion to the mean. That’s it – every trading strategy is as simple as that, in its essence.
Understand what indicators do, and that whether you use a Bollinger Band or a Keltner Channel, for example, will make little difference to your results. Then you can choose the indicators which are most suitable for your trading strategy. For example, if your strategy aims to trade with momentum, you need to use a momentum indicator.
Don’t be afraid to take little pieces from strategies here and there and fit them together in a way that uniquely fits you.
Understand that your trading psychology will play a role in finding the best trading strategy for you. For example, trend traders lose most of their trades, but win big on the winners. Can you handle that? If it doesn’t bother you, you might consider using a tight stop loss, which can lower your win rate, but boost your overall profit.
If I must emphasize one key point here, it is back test. It is easy to find historical Forex price data on major currency pairs. Almost all technical strategies can be input into excel and back tested that way, but it is also possible to use software such as SQL or MetaTrader 4 or 5 as back testing programs.
Final Thoughts
Beginners can find Forex technical analysis an overwhelming subject, even if only because there is so much to take in. So, the first thing to do is try to simplify things and filter out all the variations.
There are trend indicators, momentum indicators, and oscillators. There are breakout indicators such as Donchian Channels. Any good strategy should be able to work using just two or three major indicators, at most. Don’t get stressed about exact settings or variations – these routes just lead to over-optimization and are a waste of time.
Whatever indicators or chart or candlestick analysis you are going to use to determine when and what to trade, and in what direction, make sure you back test and find out how this indicator or pattern has worked over the past few years. Generally, you want a back test to show you the hypothetical results of at least 200 trades to be meaningful. If the back test produces losing results on this scale, the strategy needs to be either discarded or improved by the addition of filters.
For those who are relatively new to using technical analysis, another positive step you can take is try to keep things relatively simple. For example, many traders will start by aiming to master one candlestick pattern or chart pattern and then build upon that. Eventually, they will build up more potential setups based upon other patterns or indicators and test them to see what works and what does not.
Finally, technical analysis can be useful in another way. Let’s say you are considering entering a long trade based upon a bullish candlestick pattern, but you feel unsure about it as the pattern does not look optimally strong. A solution might be to have a policy of only entering a long trade when, say, the RSI indicator has a 20-period reading greater than 50. Although it makes slight difference whether the RSI is 49.9 or 50.1, having a cut-off point that helps you make decisions more quickly can be extremely helpful.
Whatever strategy you use, it is important to stick to it and to use sound money management methods. If your strategy has a positive expectancy, you will very likely make money over the long term. Additionally, you can always learn more about Forex online, in webinars, courses or Free Forex eBooks.
FAQs
Can you use technical analysis in Forex?
Technical analysis can be applied to any market, including Forex. The Forex markets tend to be very technically driven, so therefore it makes sense to use it when trading currency pairs.
What are the 3 types of analysis in Forex?
The three types of analysis used in Forex are technical analysis, fundamental analysis, and sentiment analysis. Technical analysis is the measurement of price action, fundamental analysis is the measurement of economic factors, and sentiment analysis is an attempt to measure how traders feel about specific currencies.
Which technical analysis is best for Forex trading?
There are several types of technical analysis you can apply to the Forex markets, all of which have specific strengths and weaknesses. However, the best type of technical analysis for a trader will consider their psychology, risk tolerance, and ability to recognize the attitude of the market. There is no “one-size-fits-all” type of technical analysis, so testing systems and indicators that you are interested in and seeing how it works is the only way to find your best path.
What is technical analysis in Forex?
Technical analysis in the Forex market is a study of the movement of currency pairs based on historical price and volume movements and patterns. The realm of technical analysis also includes trend analysis, mean reversion, and various indicators. The basic idea behind technical analysis is that it allows you to predict the next likely price movement based only upon historical prices.
