There are three main types of price movements: trends, continuations, and reversals. To be a well-rounded trader, understanding all three types is essential. In this article, I examine reversals to help you build a strong foundation in price action and technical analysis, which should help make you a more profitable trader.
Top Forex Brokers
As the name suggests, trend reversals are a reversal in price direction. Understanding how to trade reversals means you can enter a brand-new trend near its beginning or exit the market before it goes in the opposite direction.
Let’s get started.
What Is a Trend Reversal?
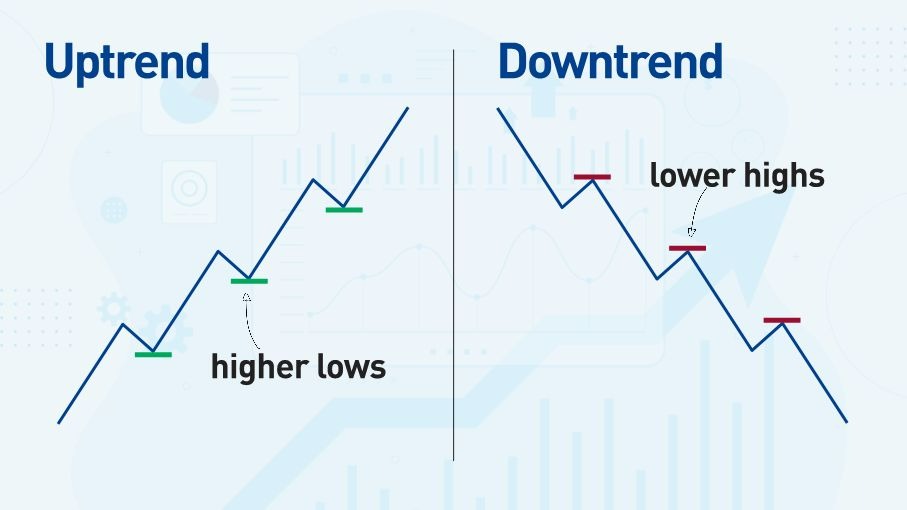
Let’s first define a trend. A trend is when the price moves consistently in an upward or downward direction:
- An uptrend is a series of rising support levels with higher highs.
- A downtrend is a series of lower highs and lower lows.
A trend reversal is when the price reverses the trend in the opposite direction.
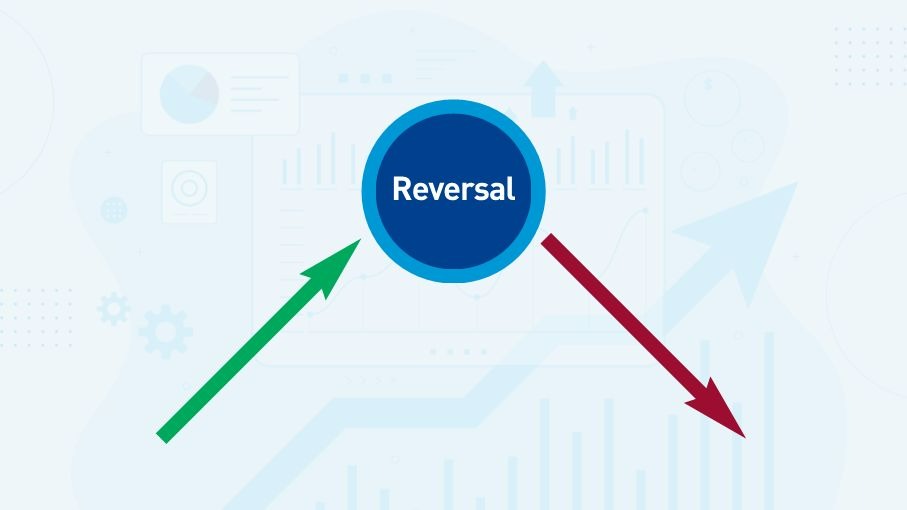
Within the area of the circle, the price will make a ‘reversal pattern.’ The reversal pattern can be quick with little volatility or might take a long time to form with lots of volatility. Reversals come in different forms, so let’s look at some methods you can use to identify these patterns.
Identifying Trend Reversals - 3 Methods
Method 1: A Break in the Trend
There are two types of trend breaks:
- A break of the last significant support or resistance.
- A break of the trendline.
Break of support or resistance in a trend:
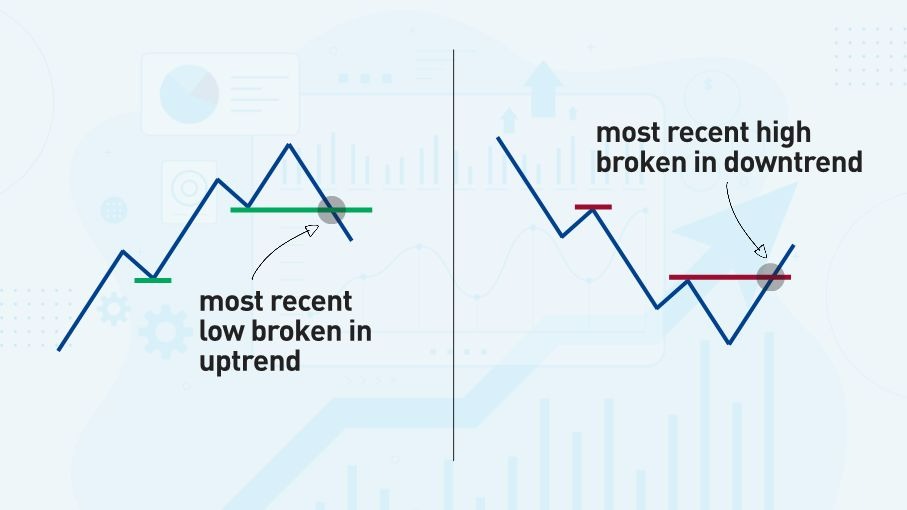
- Pros: I prefer this method to a trendline break because it is more reliable. A support or resistance level shows key buying or selling at a specific price level, and when the price breaks that level, it signals that this segment of the trend is ‘officially’ over.
- Cons: If the previous support or resistance in a trend is far from the current price level, I can lose a sizeable amount of profit before I realize the trend is over.
Break of a trendline:
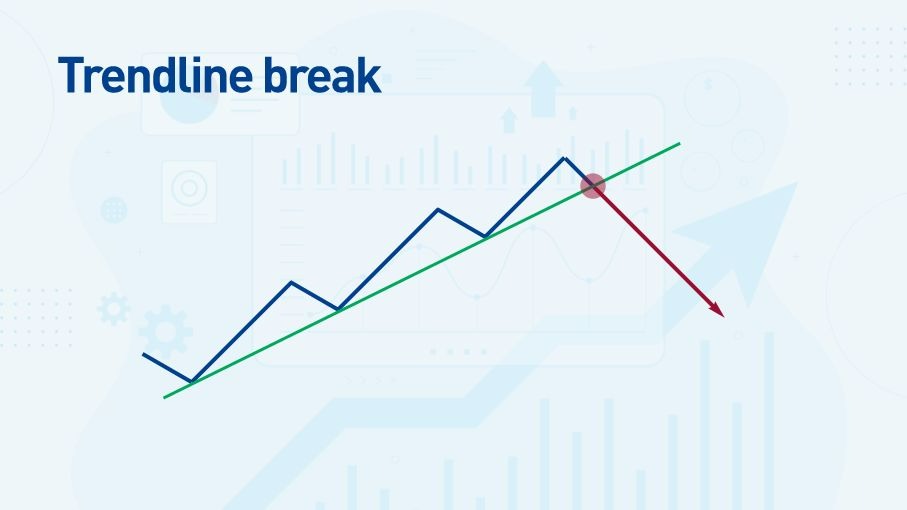
- Pros: A trendline can give an earlier signal than waiting for the price to break previous support or resistance.
- Cons: There are more false breaks of trendlines compared to false breaks of support or resistance levels in a trend. I am constantly redrawing trendlines because the price breaks my previous trendline, but the price often continues in the same direction.
A break of trend, either from a trendline break or support/resistance break, does not mean the price will automatically reverse direction. The price could go sideways instead and then continue the previous trend. It is better to wait for a new trend to develop in the opposite direction to be sure of a reversal.
Method 2: A Chart Reversal Pattern
Chart patterns in Forex or other markets are my favourite methods to spot a trend reversal—it is more reliable than a simple trend break because it more often results in the price moving in the opposite direction of the previous trend.
Let’s look at some key types of reversal patterns.
Double & Triple Tops: These are the easiest patterns in technical analysis to spot because they are the simplest.
A Double Top/Bottom: The price hits the same level twice to form a support or resistance before reversing direction.
A Triple Top/Bottom: The price hits the same level three times to form a support or resistance before reversing direction.
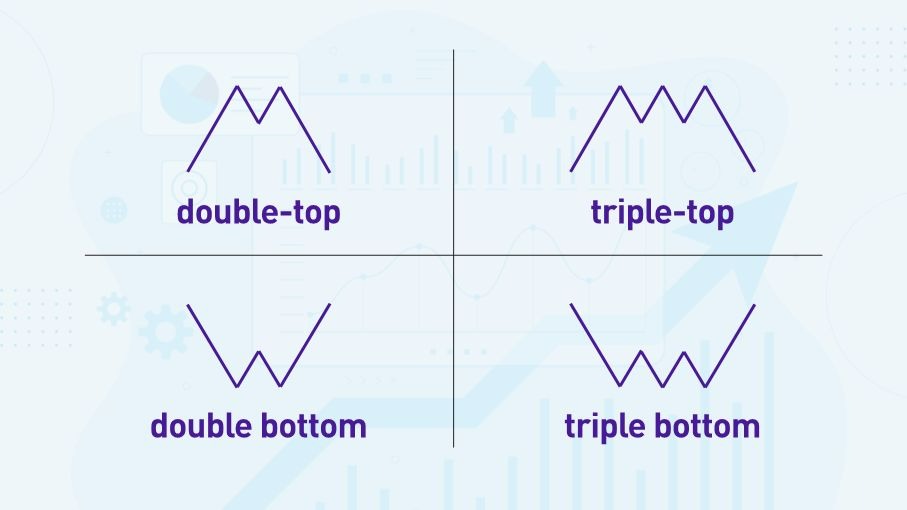
Which is better—a double or triple top/bottom? A triple is better than a double top or bottom because the price has rejected the level more times, showing a stronger sentiment of rejection.
The size of the pattern is important: For example, a larger double top is a stronger signal than a smaller triple top.
Let’s look at an example of a double-top and break down an actual trade. I’ll take this trade step-by-step to show how the price action and double top pattern showed a clear trend reversal in advance.
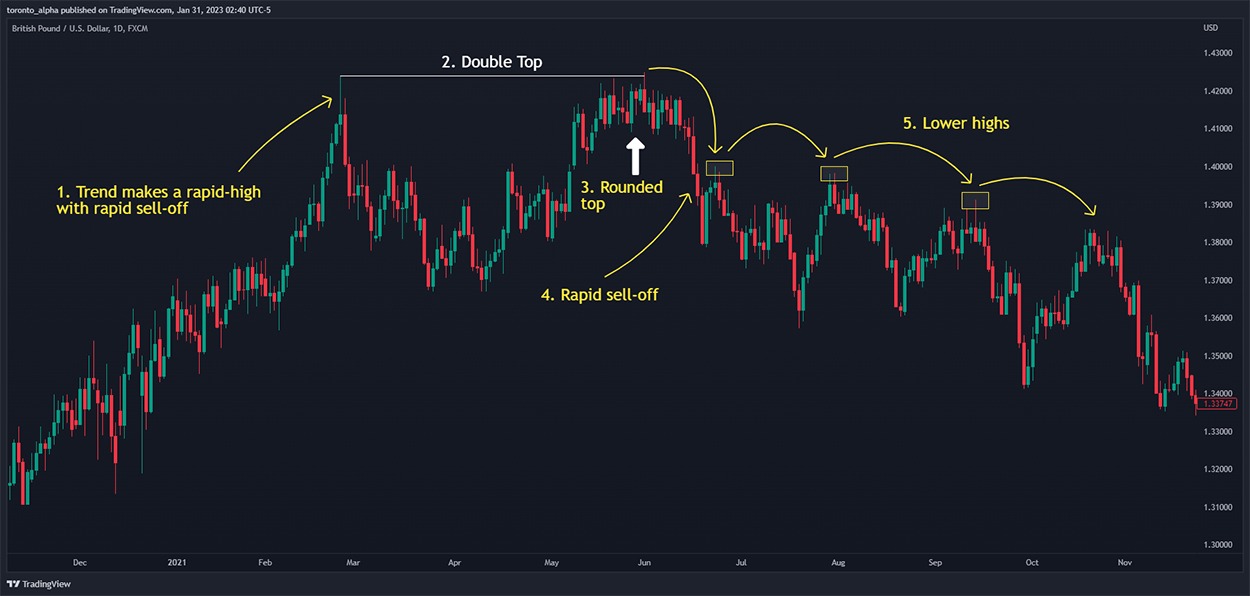
- The price is moving in a nice uptrend but suddenly accelerates when making a new high. A price acceleration should be a warning that there can be an equally steep pullback. That is precisely what happened here—the price sold off very quickly. At this point, it is too early to know if the price will make a double top.
- Next, the price reaches the previous high and makes a ‘rounded top’ formation to create a double top. A rounded top is a strong pattern by itself and even stronger when it’s part of a larger pattern, such as a double top.
- After the rounded top, the price sells off quickly, showing clear bearish sentiment.
- At this point, we can sell into pullbacks, perhaps using Fibonacci retracement levels to find entries. The price makes a series of lower highs which signifies a downtrend.
Head and Shoulders:
These are more complex than double or triple tops/bottoms, more subjective, and harder to spot. So, why trade them? Simply because head and shoulders patterns do happen, and they are powerful reversal patterns.
A head and shoulders pattern consists of three tops, but the central top is higher than the one on either side, representing a head with two shoulders next to it. Reverse this logic for an inverse head & shoulders with a bottom lower than the two shoulders next to it.
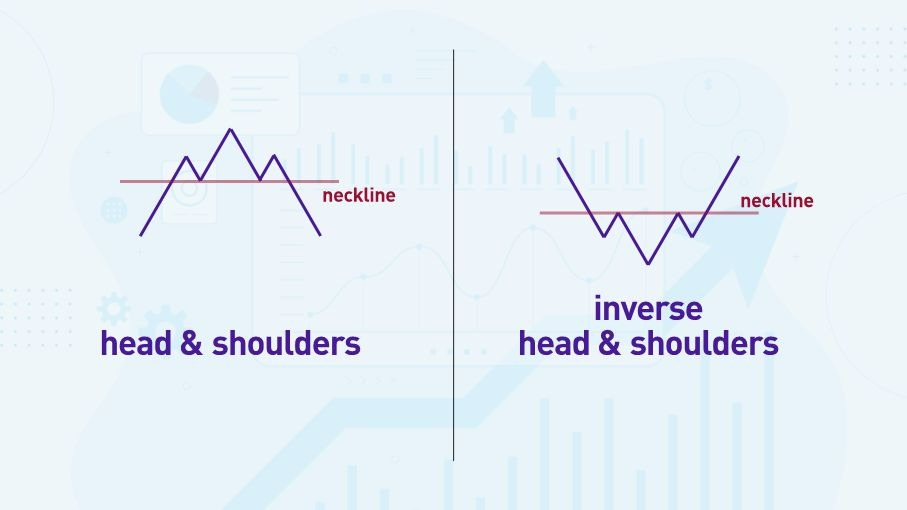
It is essential to wait for the price to break the neckline to complete the pattern. Before the neckline breaks, it’s only a potential head and shoulders pattern, not a complete reversal pattern.
Here’s a great example of a head and shoulders pattern on the AUD/USD daily chart.
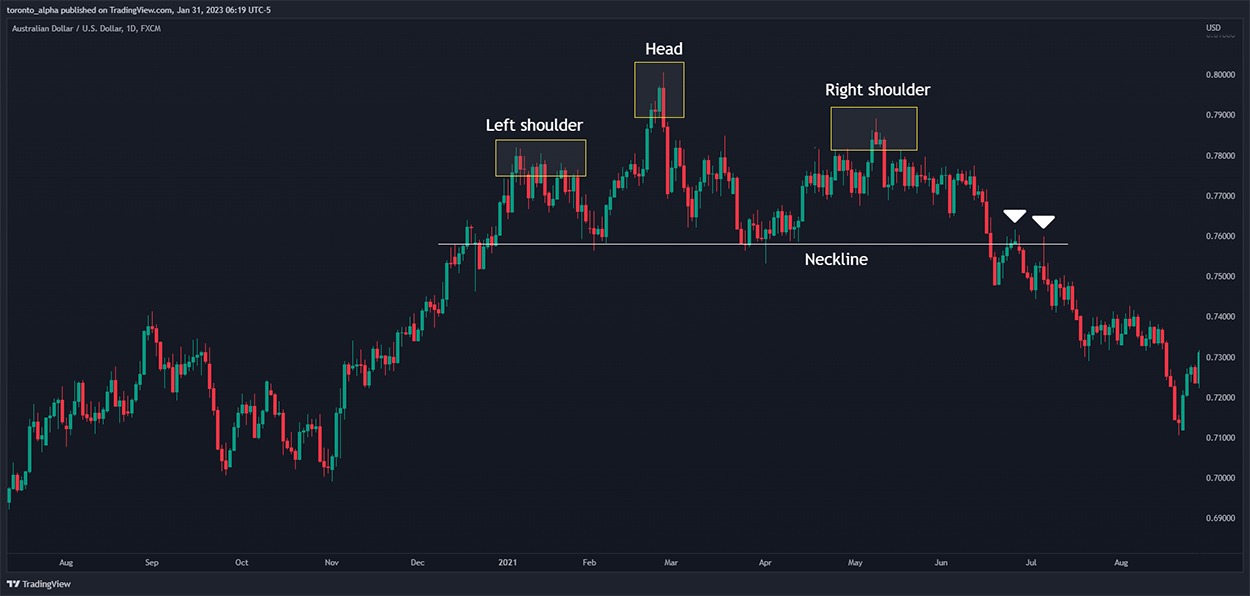
Notice how the price re-tested the neckline as resistance (marked with the white arrows). This provides excellent entry opportunities, especially the second retest, because it’s a healthy bearish pin bar.
Good chart patterns can take time to complete. In this example, the AUD/USD head and shoulders pattern took about 150 candles (six months) to complete! Of course, on smaller timeframes, the time to completion would be proportionally smaller. For example, a head and shoulders pattern with the same number of candlesticks on an hourly chart may take a few days to complete.
Bi-lateral patterns: These are usually triangle formations.
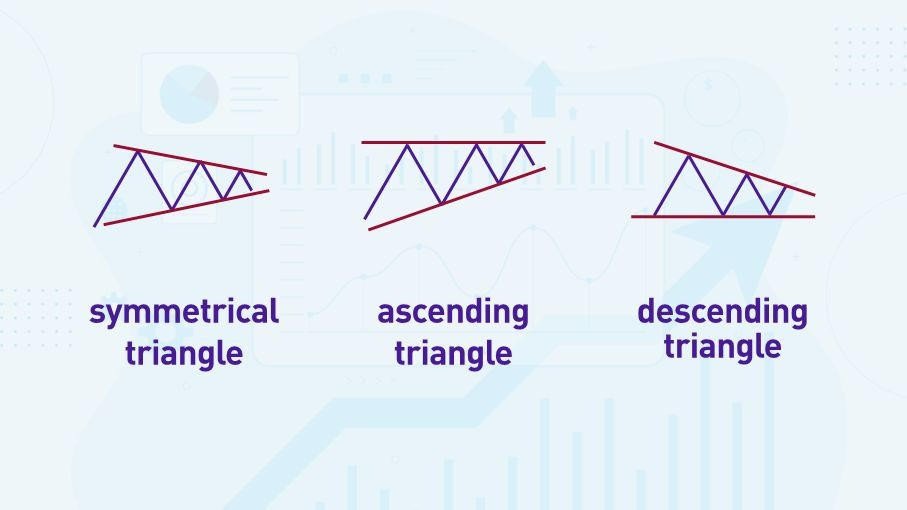
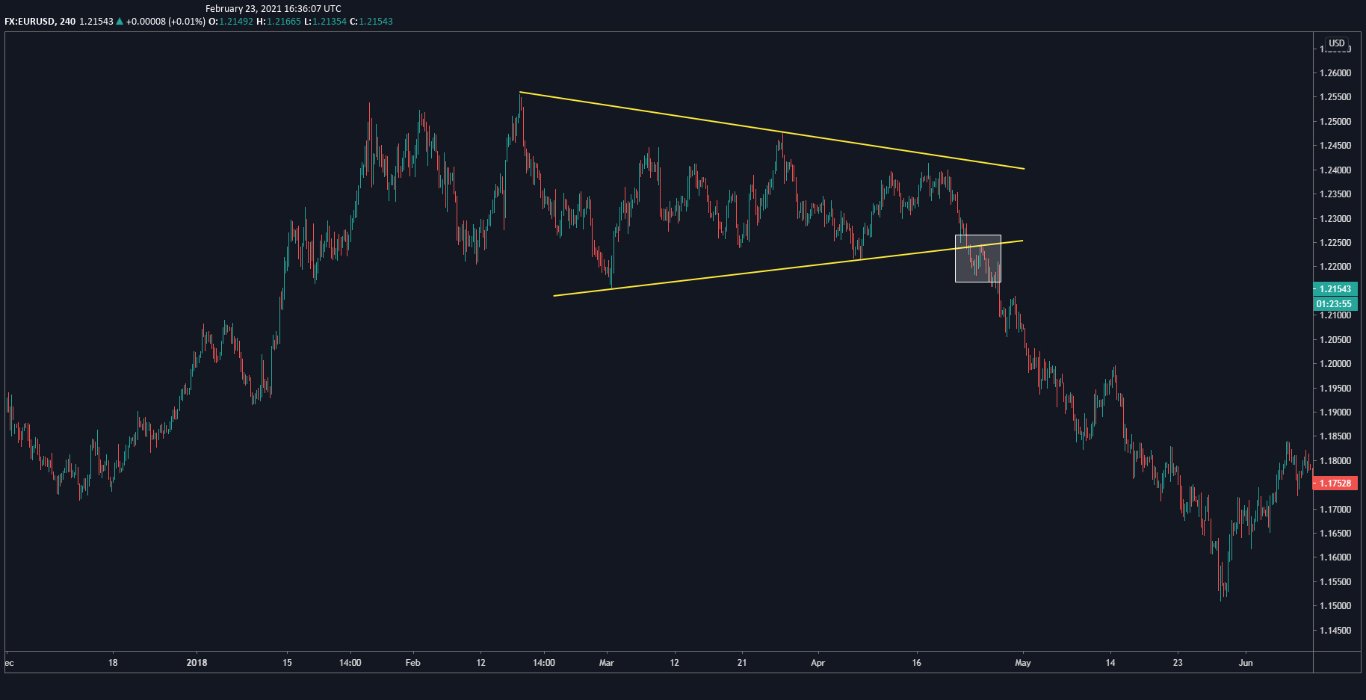
The tricky thing about these patterns is that they can be either continuation patterns, i.e., continuing the previous direction of the trend, or reversal patterns. We must wait for the price to break out on one side of the triangle to determine whether it’s more likely to be a reversal or continuation.
Here’s an example on the EUR/USD 4-hour chart.
Method 3: Momentum Indicators
So far, I have only looked at pure price action—the bedrock of technical analysis. That said, indicators can provide vital clues to assess direction. Let’s look at the most used indicators for identifying trend reversals.
Moving Averages:
Moving averages, or MAs, are the most popular type of indicator in technical analysis, and trend traders love them because they quickly shows where the price is in relation to its momentum.
How is a moving average calculated? A moving average calculates the average closing price of a specified number of candles. For example, a 10-period moving average calculates the average closing price of the last ten candles and plots this data as a line.
Types of Moving Averages:
- A Simple Moving Average (SMA) calculates a simple average or ‘mean’ of closing prices.
- An Exponential Moving Average (EMA) gives a higher weighting to the most recent closing prices.
How to Read a Moving Average:
- When the price is above a moving average, it has upward momentum.
- When the price is below a moving average, it has downward momentum.
Using Two Moving Averages: Placing a single moving average on a chart and watching the price wiggle around the line is not a sophisticated way to get information about price momentum. A better way is to place two moving averages on the chart:
- A fast MA calculates the line using a smaller number of closing prices and is seen closer to the price. A slow MA calculates the line using a larger number of closing prices.
- When the fast MA crosses the slow MA from below, it’s a bullish signal.
- When the fast MA crosses the slow MA from above, it’s a bearish signal.
Golden Cross Moving Averages: A popular moving average setup is a 50 EMA and 200 EMA on a daily chart. These settings have been called the “golden cross” or “bull cross.”
Here is the golden cross in action on a daily chart of Gold in USD. I happen to be looking at Gold for this, but that has nothing to do with the name, golden cross! I can use the golden cross settings on a Forex pair, stocks, etc. The golden cross in recent years has been a very effective long-term buy signal in the S&P 500 Index.
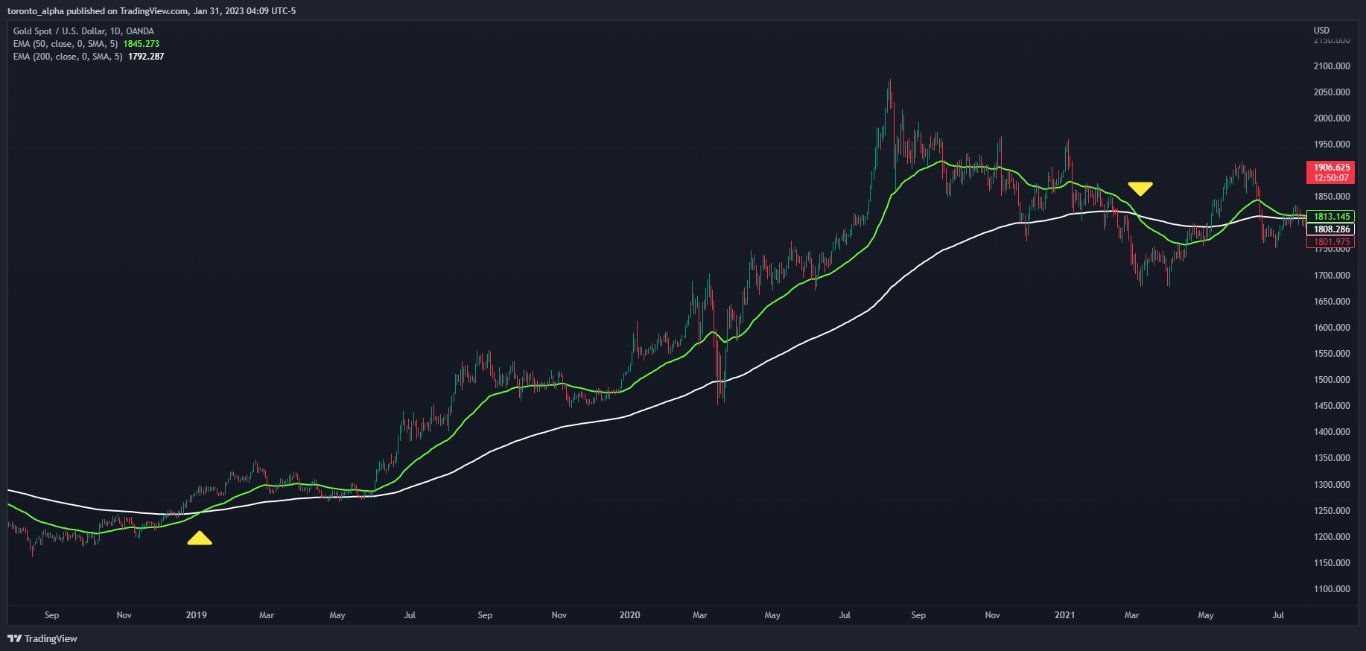
The golden cross on this chart shows nicely how it captured a long bullish trend starting in 2019 when the 50 EMA crossed the 200 EMA from below. It would have kept you in the trade all the way to the beginning of 2021 when the 50 EMA crosses below the 200 EMA, this time from above.
When trading reversal indicators in Forex or other markets, I would not use moving average crossovers like this by themselves—I would also look at support and resistance and chart patterns—but these indicators can alert you to potential new trends or reversals.
Other trend reversal indicators: Moving averages are not the only trend indicator. Traders also commonly use MACDs (derived from moving averages) and pivot points to identify trend reversals.
How to Identify High-Probability Trend Reversals
I will break this down into a step-by-step process using the ideas so far in this article.
Step 1: Identify a trend. Make sure it’s clear, and mark the rising supports if it is an uptrend or falling resistances if it is a downtrend. The trend may also have a clear trendline.
Step 2: Wait for the trend to break. For example:
- The price breaks the most recent support for an uptrend or resistance for a downtrend.
- The price breaks the trendline.
- A momentum indicator can also assist in signalling that a trend has ended.
Step 3. Look for a confirmation that the price will reverse. The price may immediately begin to reverse with a new trend in place. However, more often than not, there will be a reversal pattern, e.g., double/triple top or bottom, or a more complex chart reversal pattern, such as a head and shoulders or rounded top/bottom pattern.
Conclusions
When trading Forex reversals, there are often clear technical signals that the trend has ended and a new one is about to start in the opposite direction. Go through a step-by-step process of marking the critical areas of a trend: horizontal support and resistance levels and trendlines. When the price breaks these levels, that segment of the trend is most likely over. That does not automatically mean the trend will reverse—the price could go sideways for a long time— but the previous segment of a trend has finished for now. The price must establish new momentum in either the original direction of the trend or the opposite direction.
A reversal pattern is an excellent indication that the new momentum will be in the opposite direction, and that’s an opportunity to enter the market in the direction of a new trend.
FAQs
How do you confirm reversals?
You can confirm reversals when the previous trend has broken and a new trend has begun to move in the opposite direction.
Which type of indicators are used to find reversals in the market?
Moving Averages, MACDs, and Pivot Points are the most popular indicators used to find reversals in the market.
What is the best indicator for reversals?
Moving averages are widely held to be the best indicator for identifying reversals.
What are reversal indicators?
A reversal indicator helps to show that the price is reversing direction from the previous direction of the trend.
