
Success in Forex trading is highly dependent upon which currency pairs you choose to trade each week and in which direction, and less so on the exact trading methods you use to determine trade entries and exits.
This weekly market report aims to find which major Forex pairs are at key levels or in identifiable trends that will present trading opportunities. Of course, you can then apply your methodology to pin entries and exit points.
Let’s begin by looking at the upcoming economic calendar. The week of March 29 – April 2 is unusually quiet, with very few high-impact announcements scheduled. On Thursday, April 1, there are all-day OPEC meetings, and on Friday, April 2, there are several employment announcements at 8:30 a.m. ET / 1:30 p.m. GMT. There are some medium-impact economic announcements scattered throughout the week.
With such few high-impact announcements, we can expect very few fundamentally driven reversals in trends for the first few days of the week and possibly the entire week. Trends will mainly be driven by technical and sentiment factors.
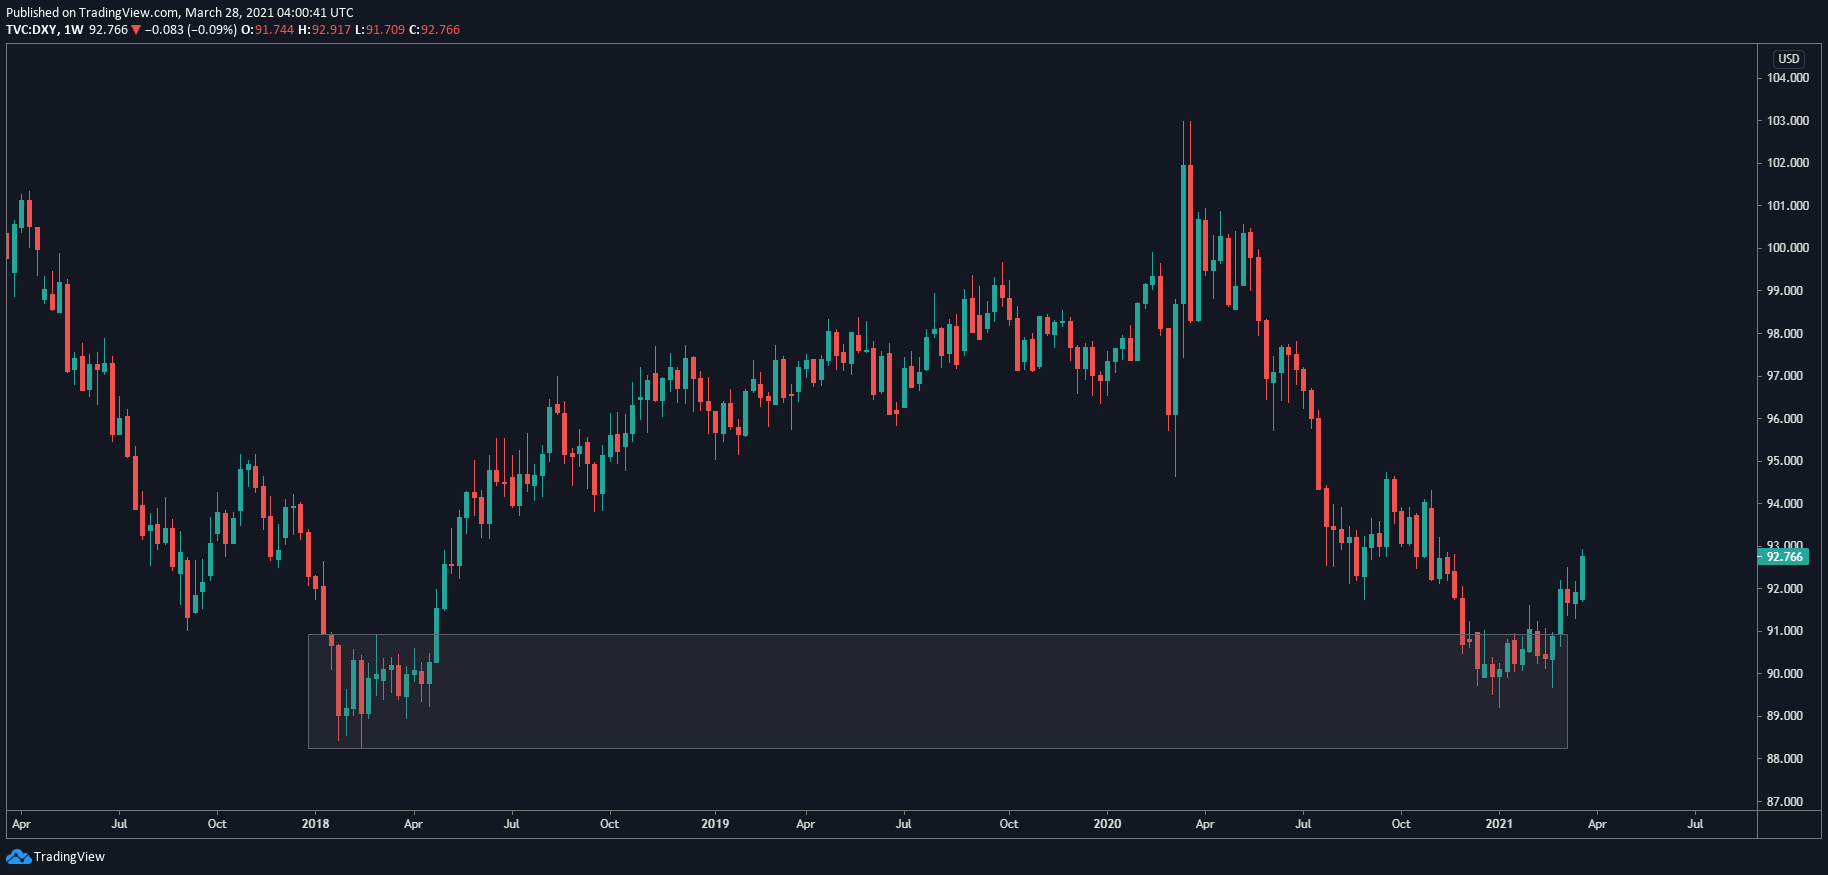
Let’s begin by examining the long-term and near-term picture of the Dollar Index. For reference, the U.S. Dollar Index is an index of the value of the USD relative to a basket of foreign currencies, often referred to as a basket of U.S. trade partners’ currencies. The index goes up when the U.S. dollar strengthens compared to other currencies. There are ways to trade the U.S. Dollar Index by itself, but most Forex traders use the index as a gauge for the other Forex majors.
As represented by this Weekly chart, the long-term dollar index picture has been trending up since the beginning of 2021 (after having made steep declines for much of 2020) when the index reached a previous area of support made in early 2018.
Let’s look at the 4-hour chart to give us a closer look at the week ahead.
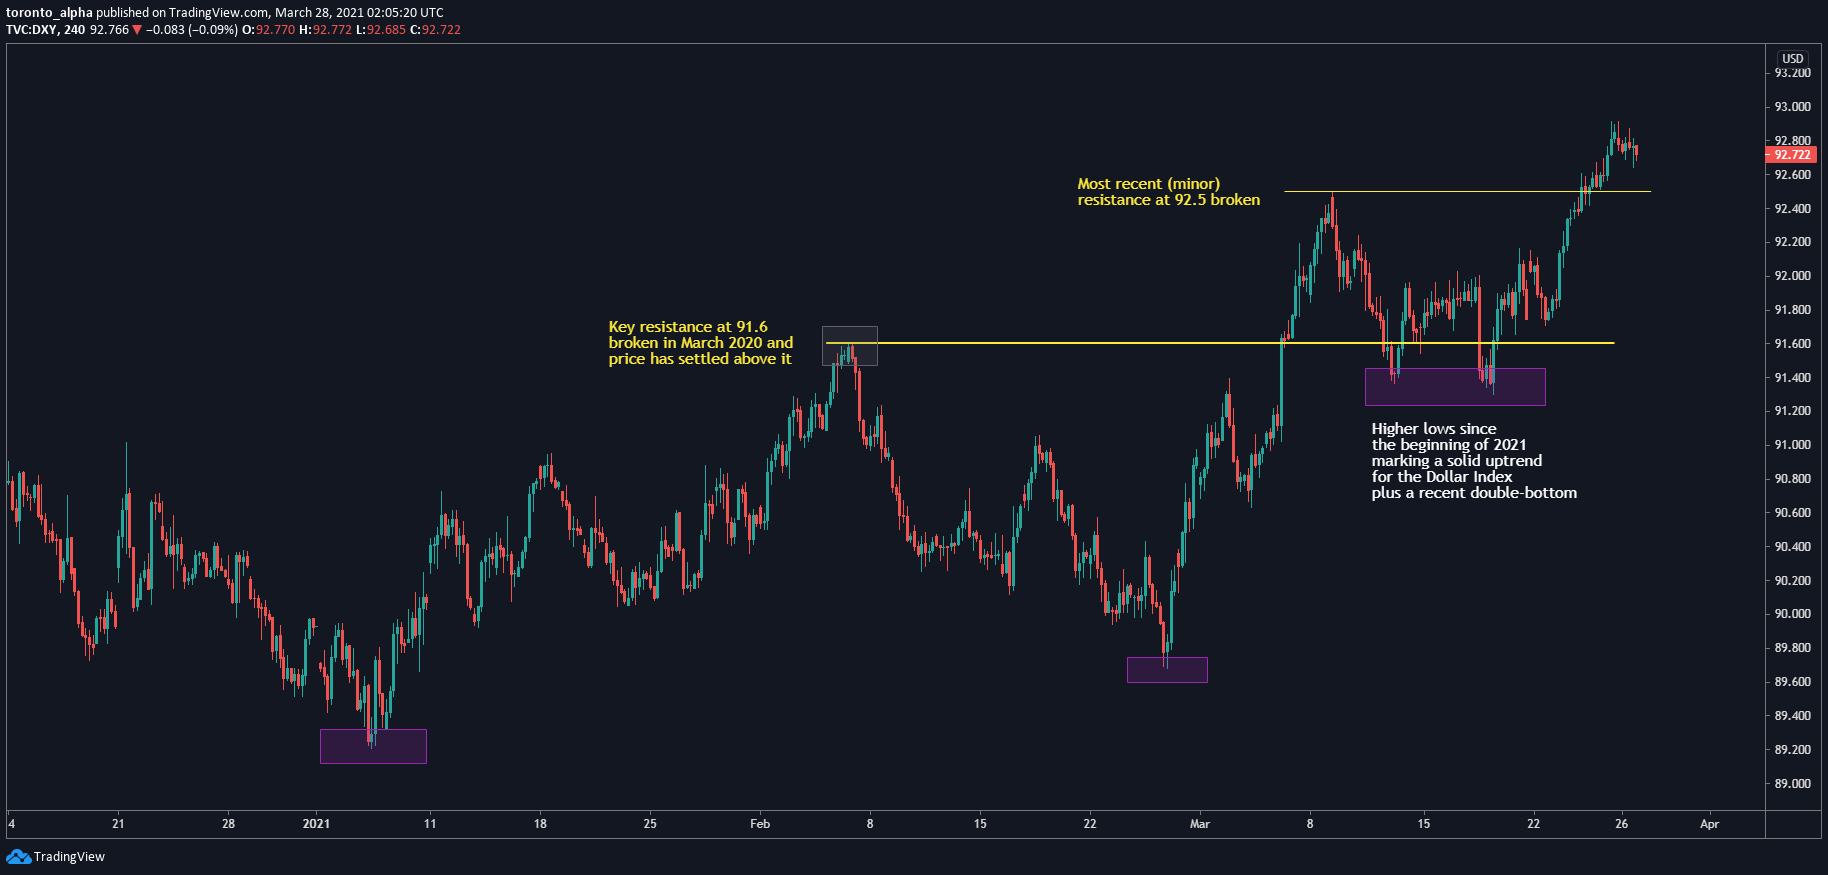
The index made its low for the year on January 6 and has been trending up steadily since. Price made a key resistance on February 5, but the price broke above it a month later in early March, and although it dipped back below the resistance a couple of times, it made an excellent base with a double bottom. The index is currently sitting above the last minor resistance level at 92.5. The price may retrace a little to test 92.5, but overall, the dollar index looks bullish.
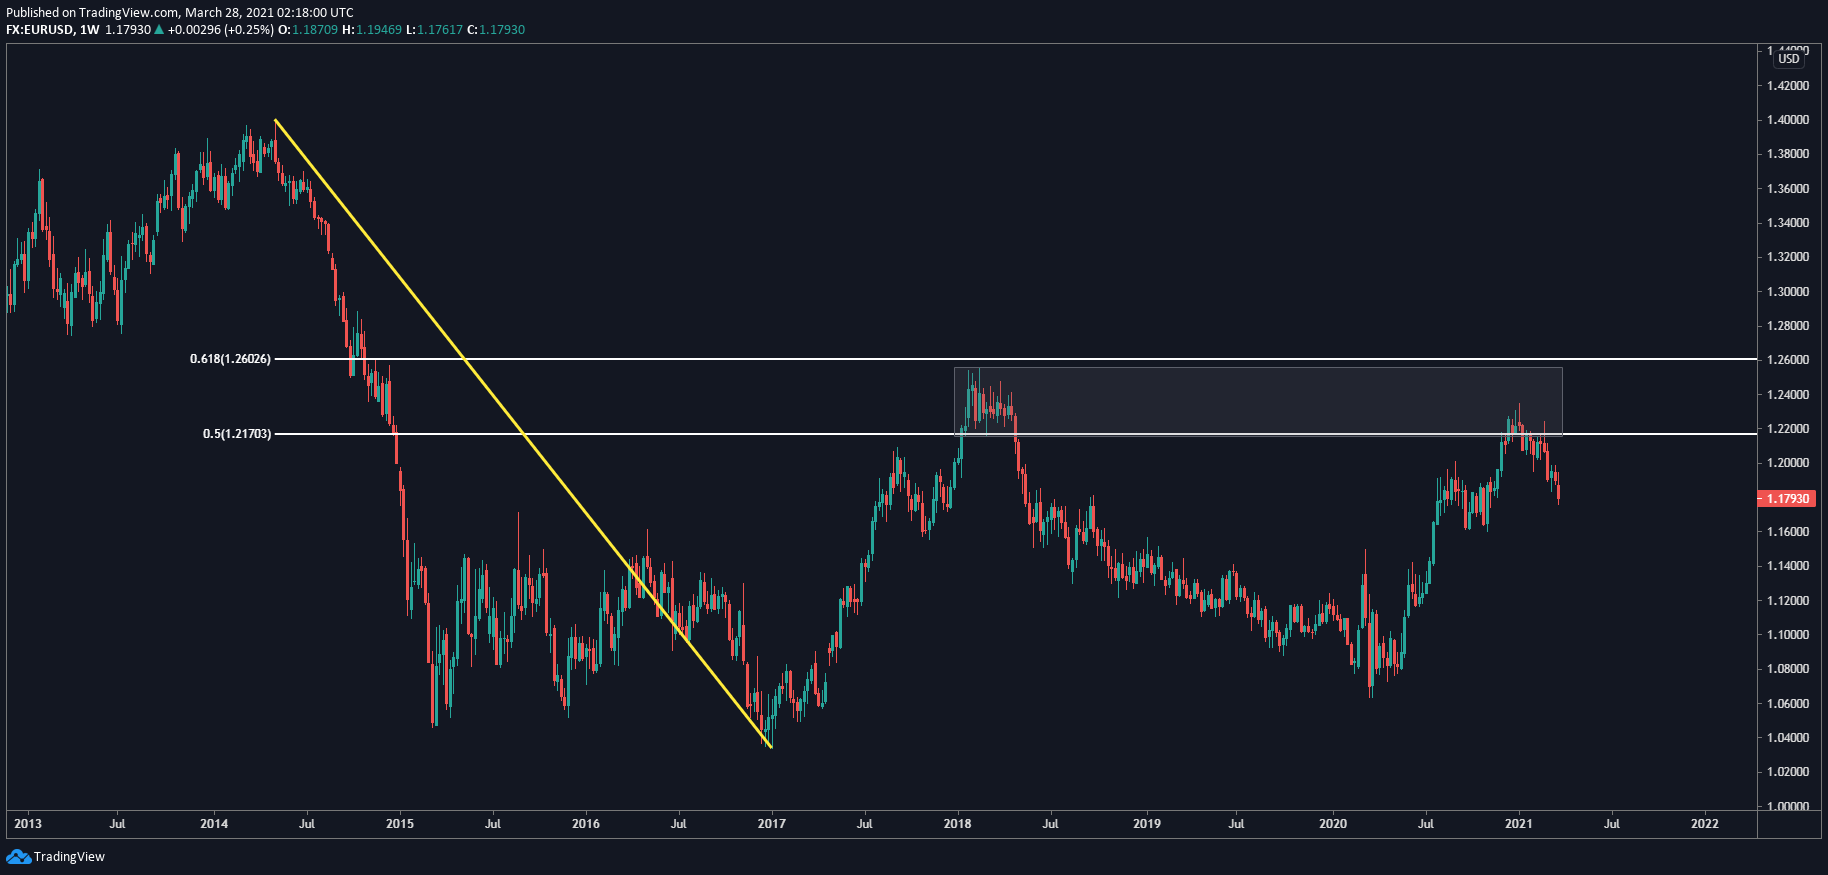
The EURUSD is in an interesting long-term place. The weekly chart shows how the price has reacted to a previous resistance area made in early 2018, which is also in a long-term Fibonacci zone between 50% and 61.8%.
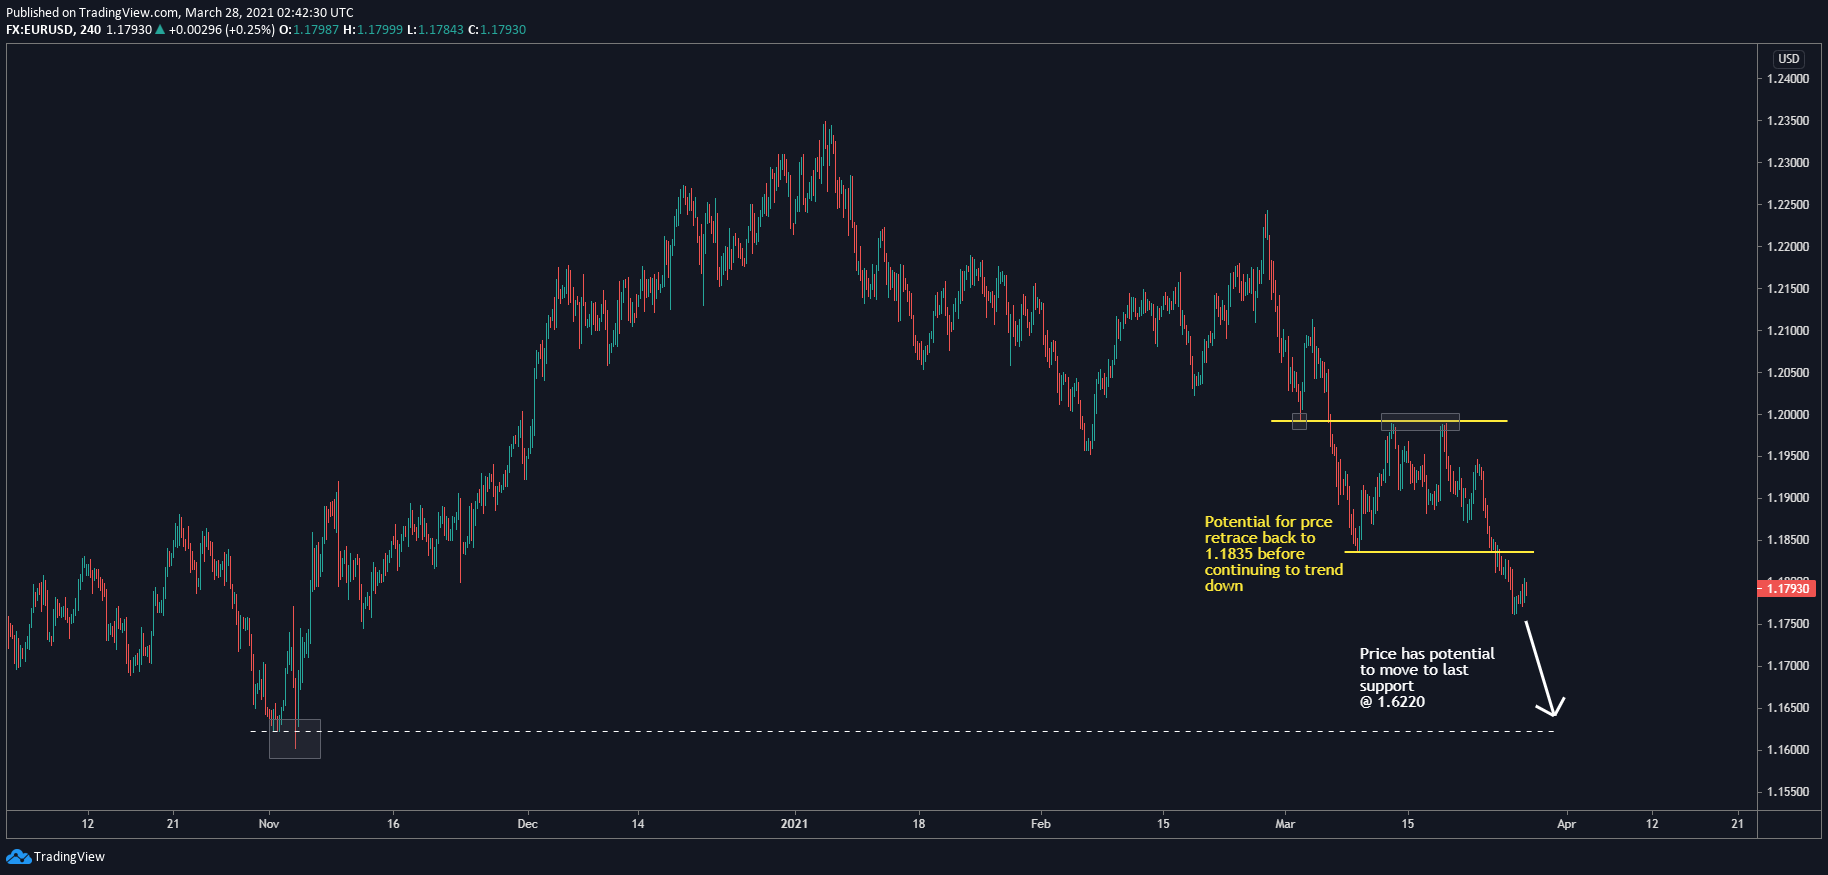
The 4-hour chart shows the price has broken through the last two key support areas to continue the downtrend that began in January 2021. Of course, there can be retraces to previous levels as a test, and in this case, the previous level is around 1.1835. That said, the momentum is bearish, and the price has plenty of room to move to the last support area made in November 2020 at around 1.6220.
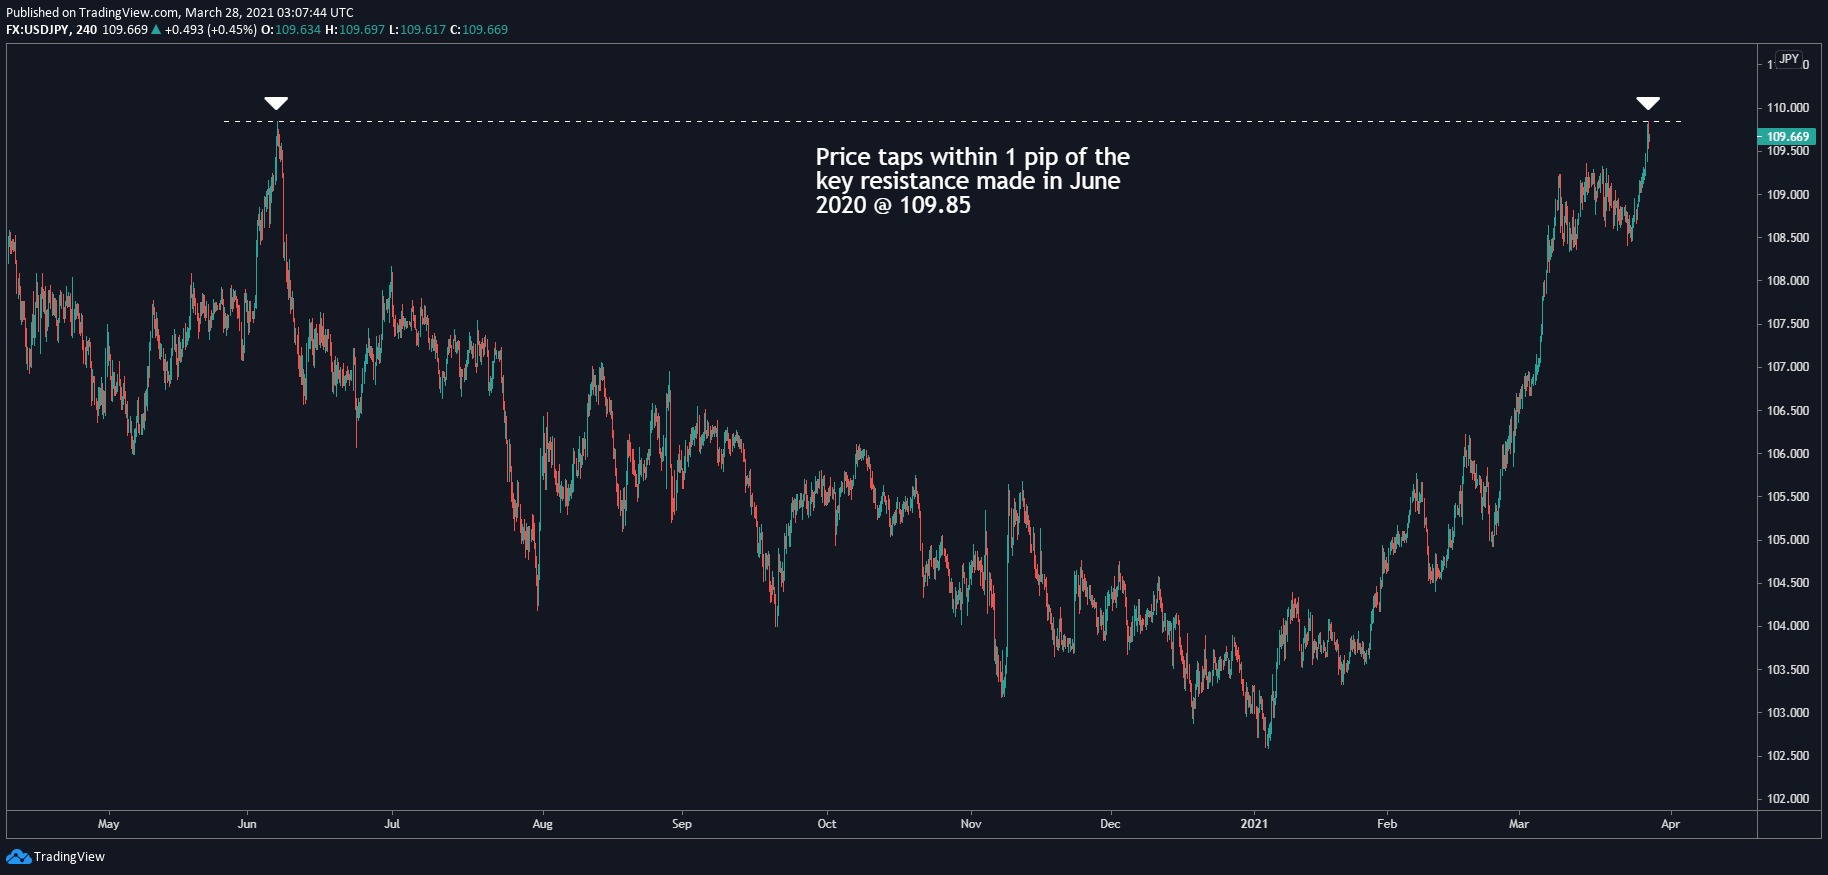
Moving on to USDJPY: buyers beware!
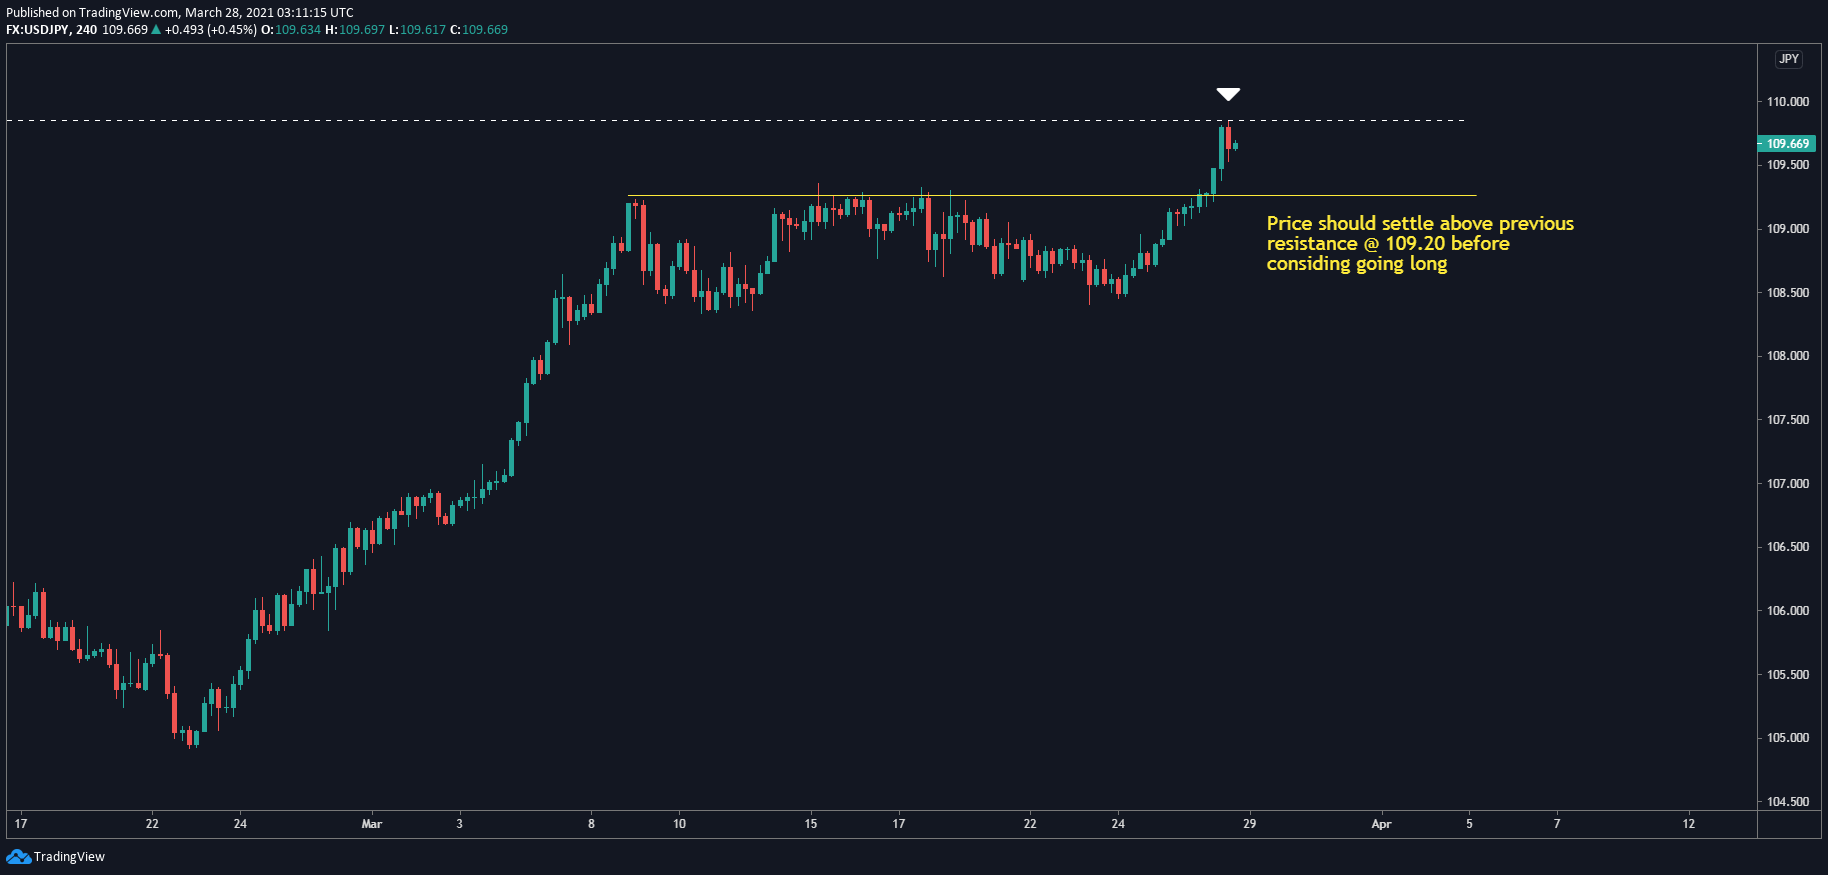
It’s in a strong uptrend, and nobody can dispute that. The interesting part is that the price has tapped, within 1 pip, a key resistance level made on June 5, 2020. If I were long USDJPY, I would be very tempted to take profits. My bias for this pair is still bullish, but I want to see the price break through the resistance at 109.85 and settle above it, preferably as support, and then move in for a long position.
Another possible way to enter long is to wait for the price to settle above the previous minor resistance it broke through recently at 109.20.
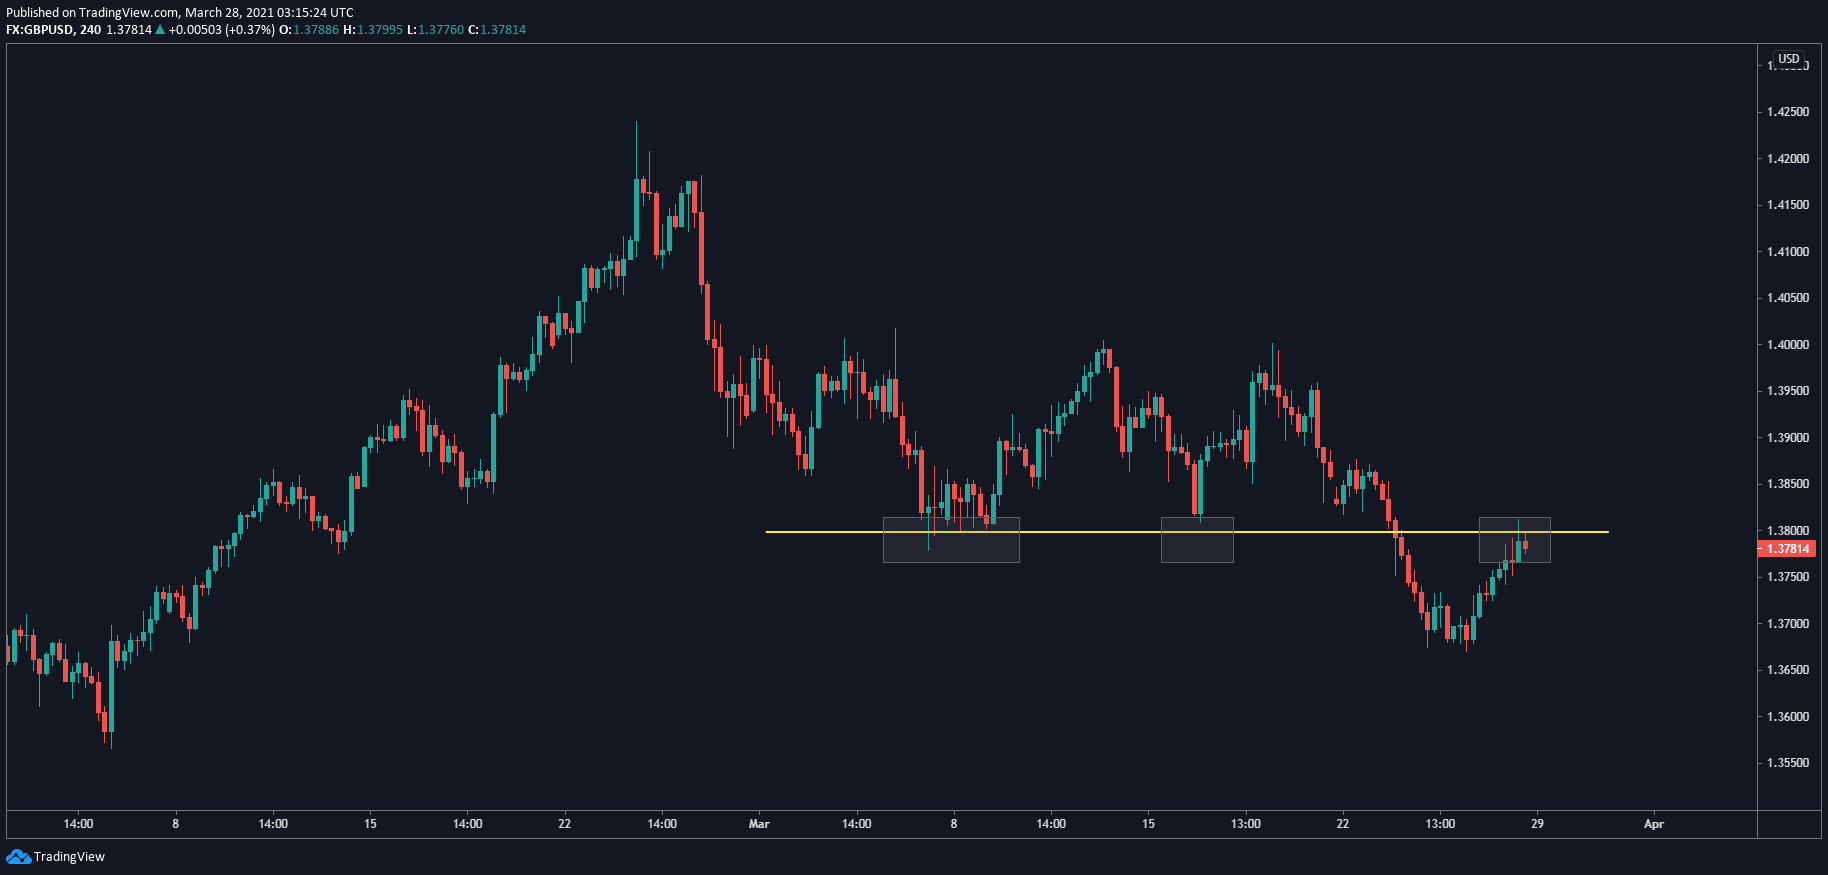
GBPUSD: After trending up for a year since March 2020, the price is now at a critical inflection point when it reached the previous resistance made in early 2018. On the 4-hour chart, once the trend started to collapse on February 25, it made a support at around 1.3800, and then subsequently broke through that. The price has now retraced back up to near that 1.3800 level. It’s a good test of that level as resistance, and a short play would be in line with a bullish dollar index.
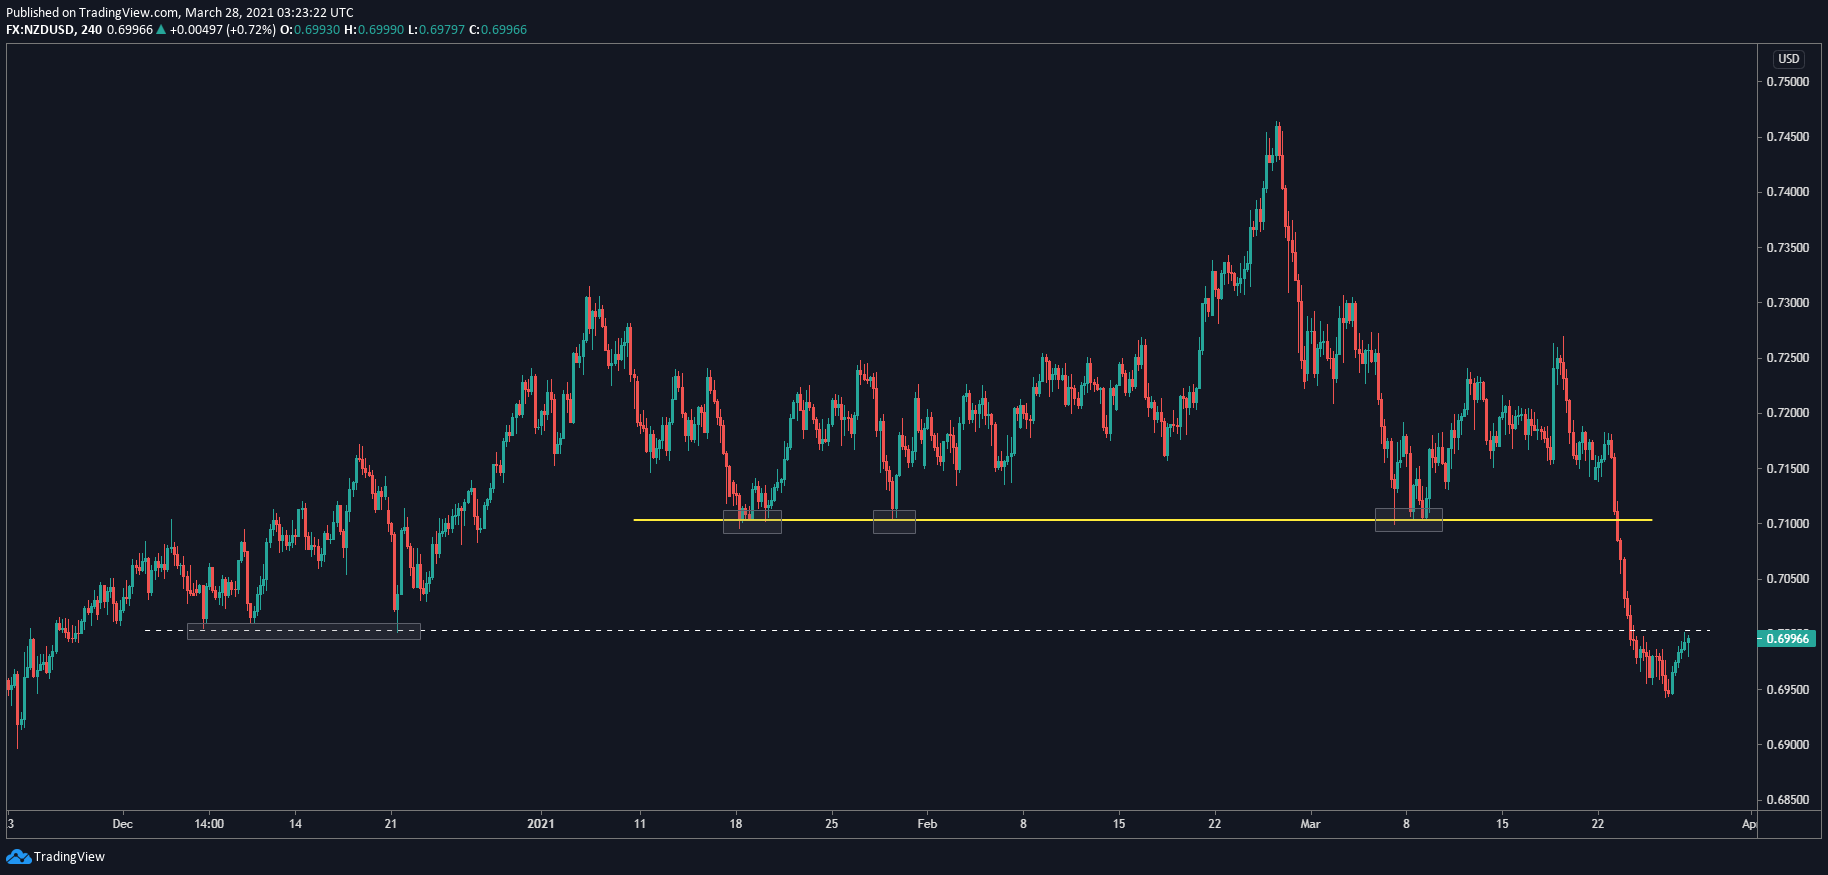
NZDUSD: Like GBPUSD, after NZDUSD trended up for a year since March 2020, the pair reversed at an area where it had met resistance from late 2016 to early 2018. On the 4-hour chart, price broke a key support at around 0.7100 that it made when the uptrend was reversing. It has since broken a minor support level at about 0.7000 and retraced back to it. The bias is bearish for this pair. It presents a good entry opportunity, but you could wait for a higher retrace (with the risk of missing the trade).
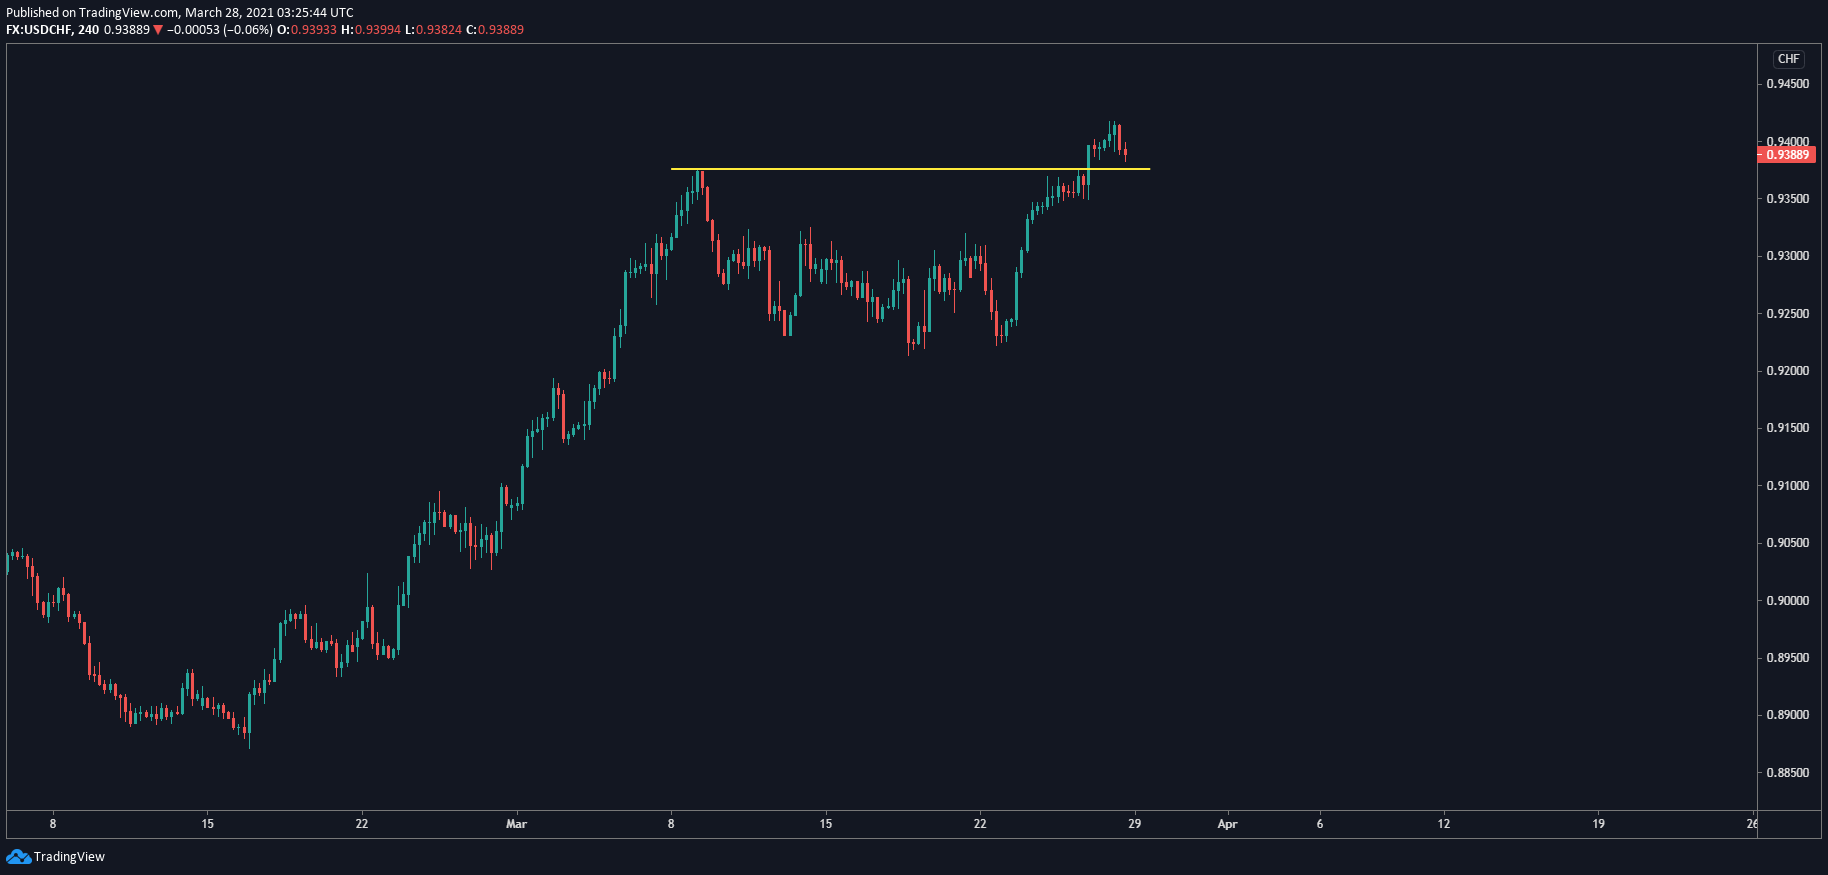
USDCHF: In a clear uptrend and with the price sitting above the last key resistance on the 4-hour chart at 0.9375, the bias for this pair is bullish.
Bottom line:
- The Dollar Index bullishness is confirmed when looking at the individual major Forex pairs. Our analysis does not indicate any major Forex pair where we should short the USD. All the trading opportunities we see in the major pairs are bullish USD.
- We’re bearish EURUSD after it reversed at a long-term resistance level, and the 4-hour trend is looking nicely bearish.
- USDJPY is in a strong uptrend, but in the immediate trading days ahead, we need to watch how it reacts to the 109.85 resistance level it’s sitting on.
- GBPUSD and NZDUSD, although unrelated economically, show similar patterns: a year of trending up, hitting long-term resistances, and 4-hour charts pointing down with broken support levels.
- USDCHF is in a clear uptrend and sitting above its most recent resistance level at 0.9375.
As always, mind your risk. This is a foundational element of trading success. The two easiest ways of managing risk: 1) set a stop-loss and make sure the target you have is at least the stop-loss size, or preferably higher. This principle will give you good risk/reward ratios. 2) Apply position sizing to your trades so that no single trade, if stopped-out, will risk more than a pre-determined percentage of your total account size.